
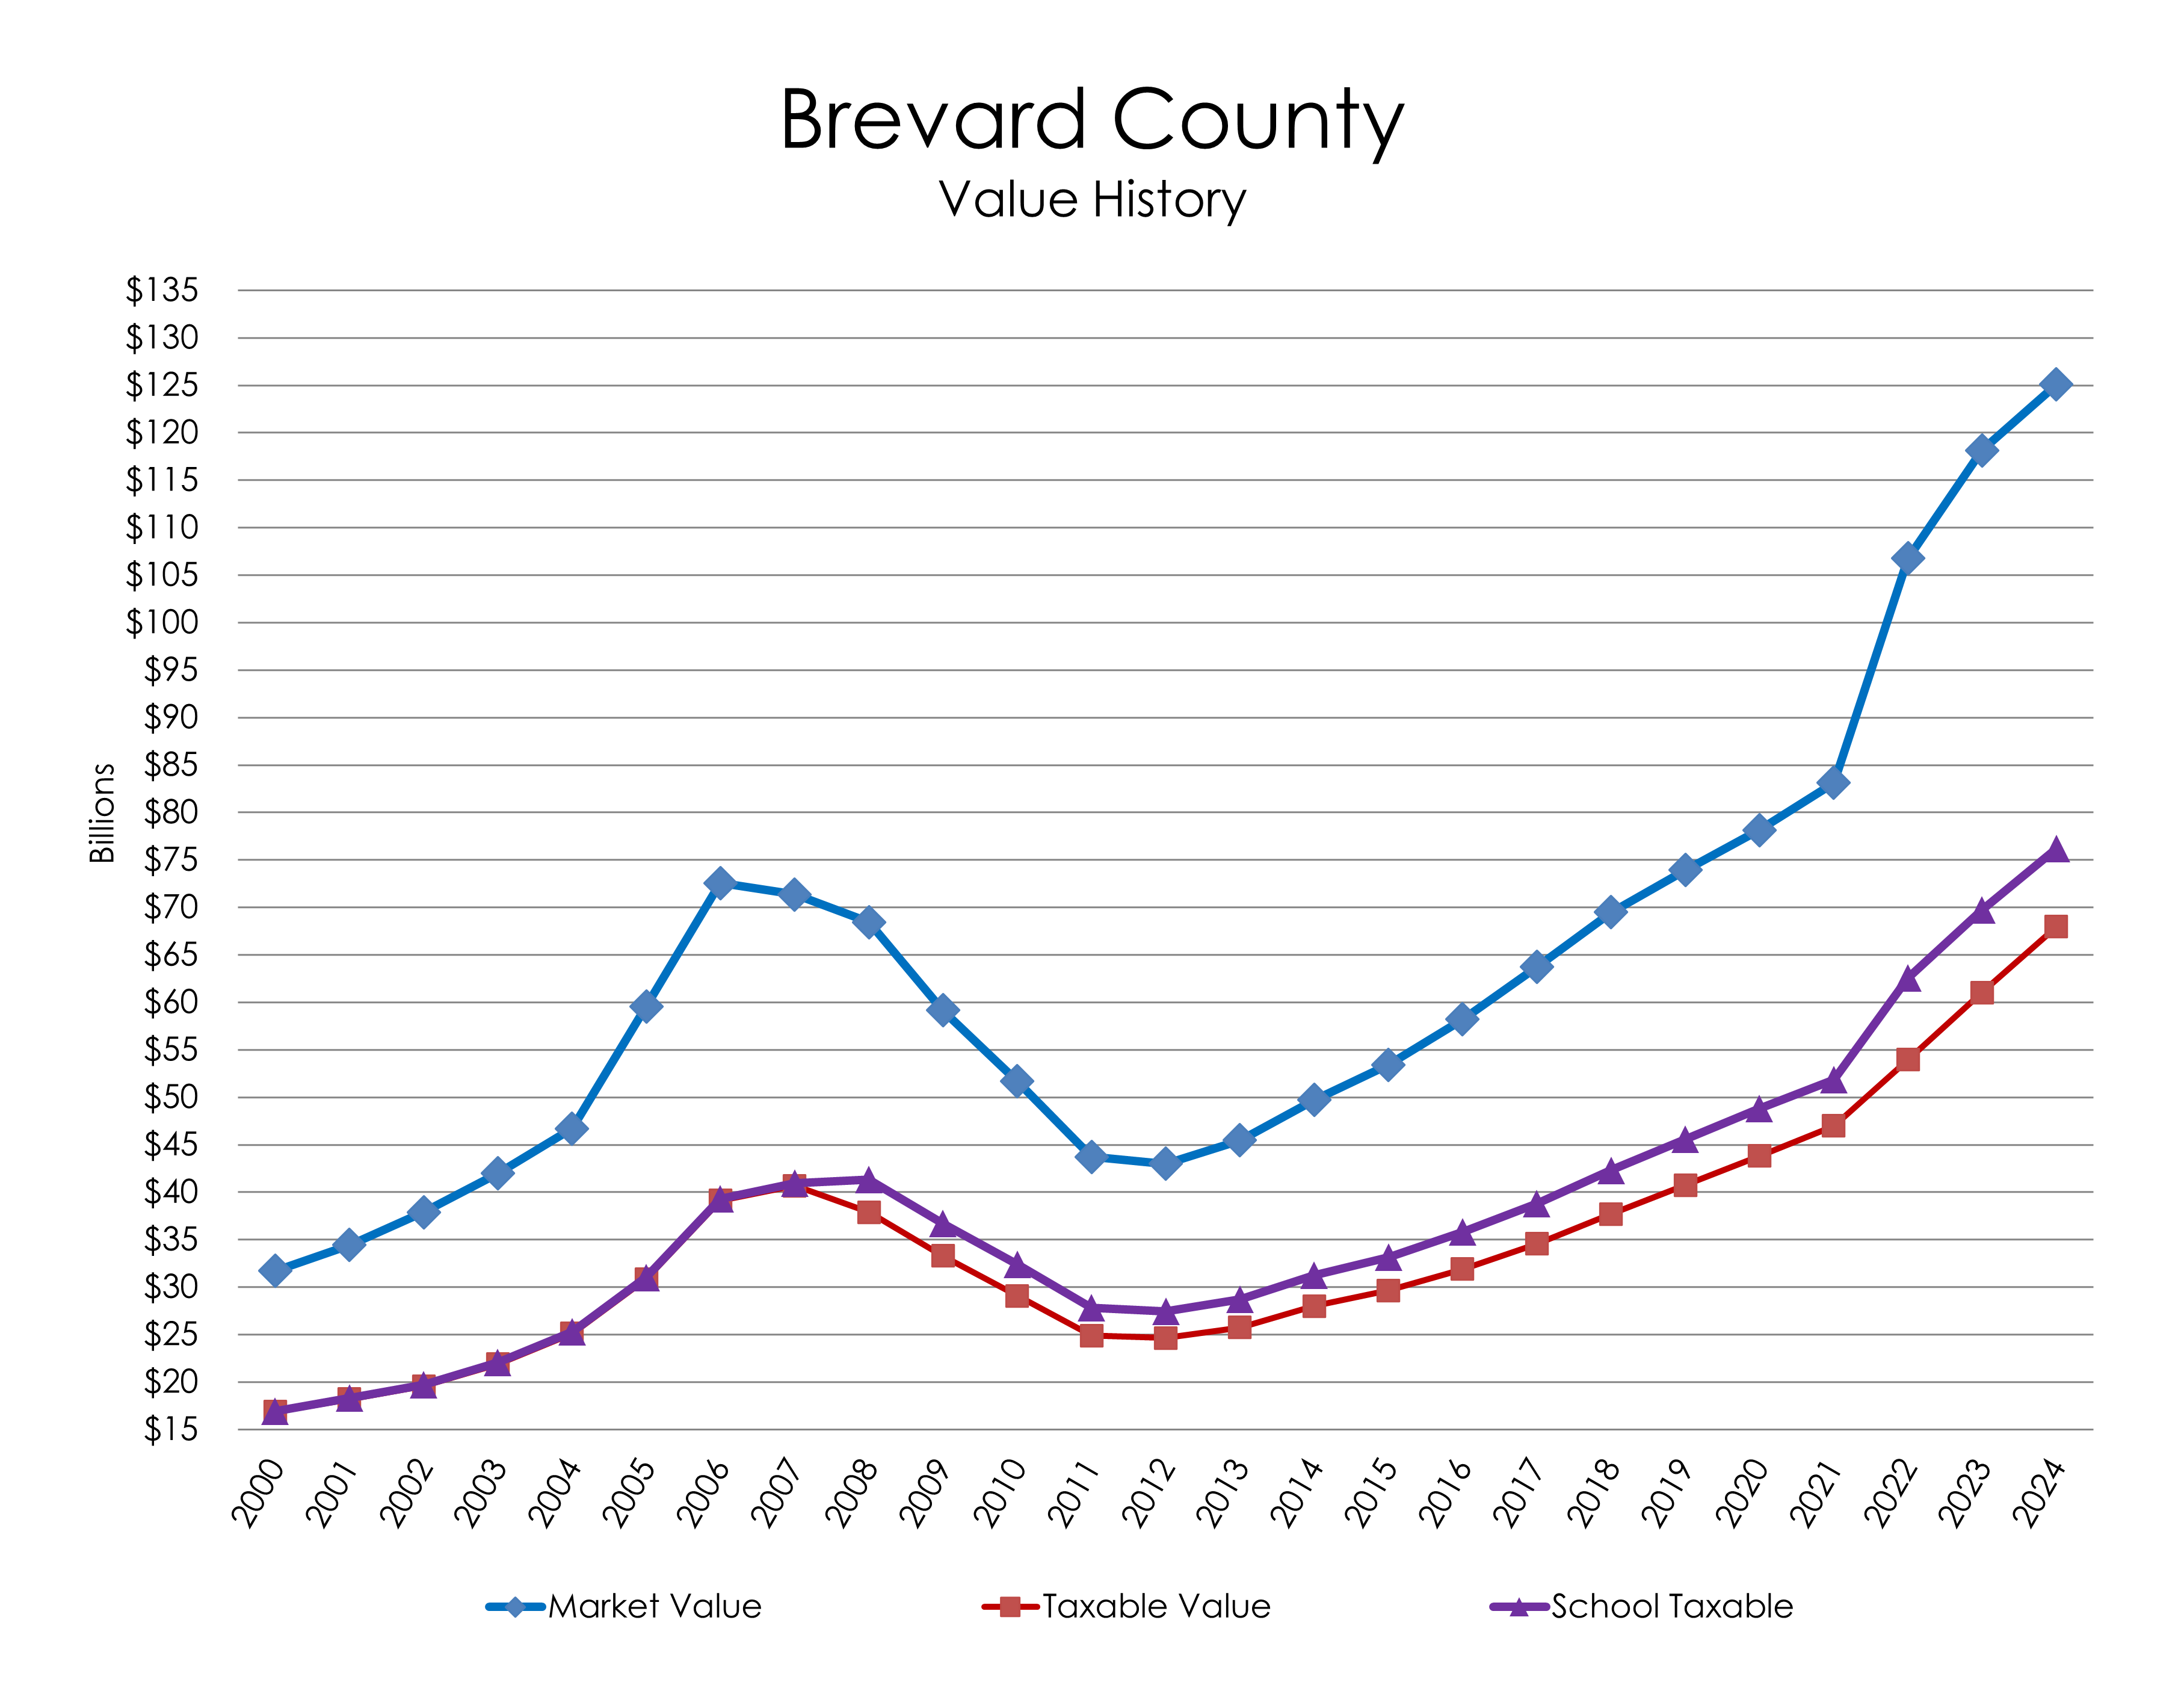
 This chart shows how market values in Brevard County followed the real estate sales boom to 2006 and the subsequent bubble burst. The split in non-school taxable/school taxable values in 2007 is a result of the voter-approved additional $25,000 Homestead Exemption to qualified homeowners. Savings as a result of the Save Our Homes (SOH) cap reached near $0 when values bottomed out in 2012. A tick upwards indicates that homeowners’ assessed values are again being capped well below market value per Florida law.
BCPAO.us
Welcome
BCPAO.us
Brevard County Property Appraiser
Dana Blickley, CFA
This chart shows how market values in Brevard County followed the real estate sales boom to 2006 and the subsequent bubble burst. The split in non-school taxable/school taxable values in 2007 is a result of the voter-approved additional $25,000 Homestead Exemption to qualified homeowners. Savings as a result of the Save Our Homes (SOH) cap reached near $0 when values bottomed out in 2012. A tick upwards indicates that homeowners’ assessed values are again being capped well below market value per Florida law.
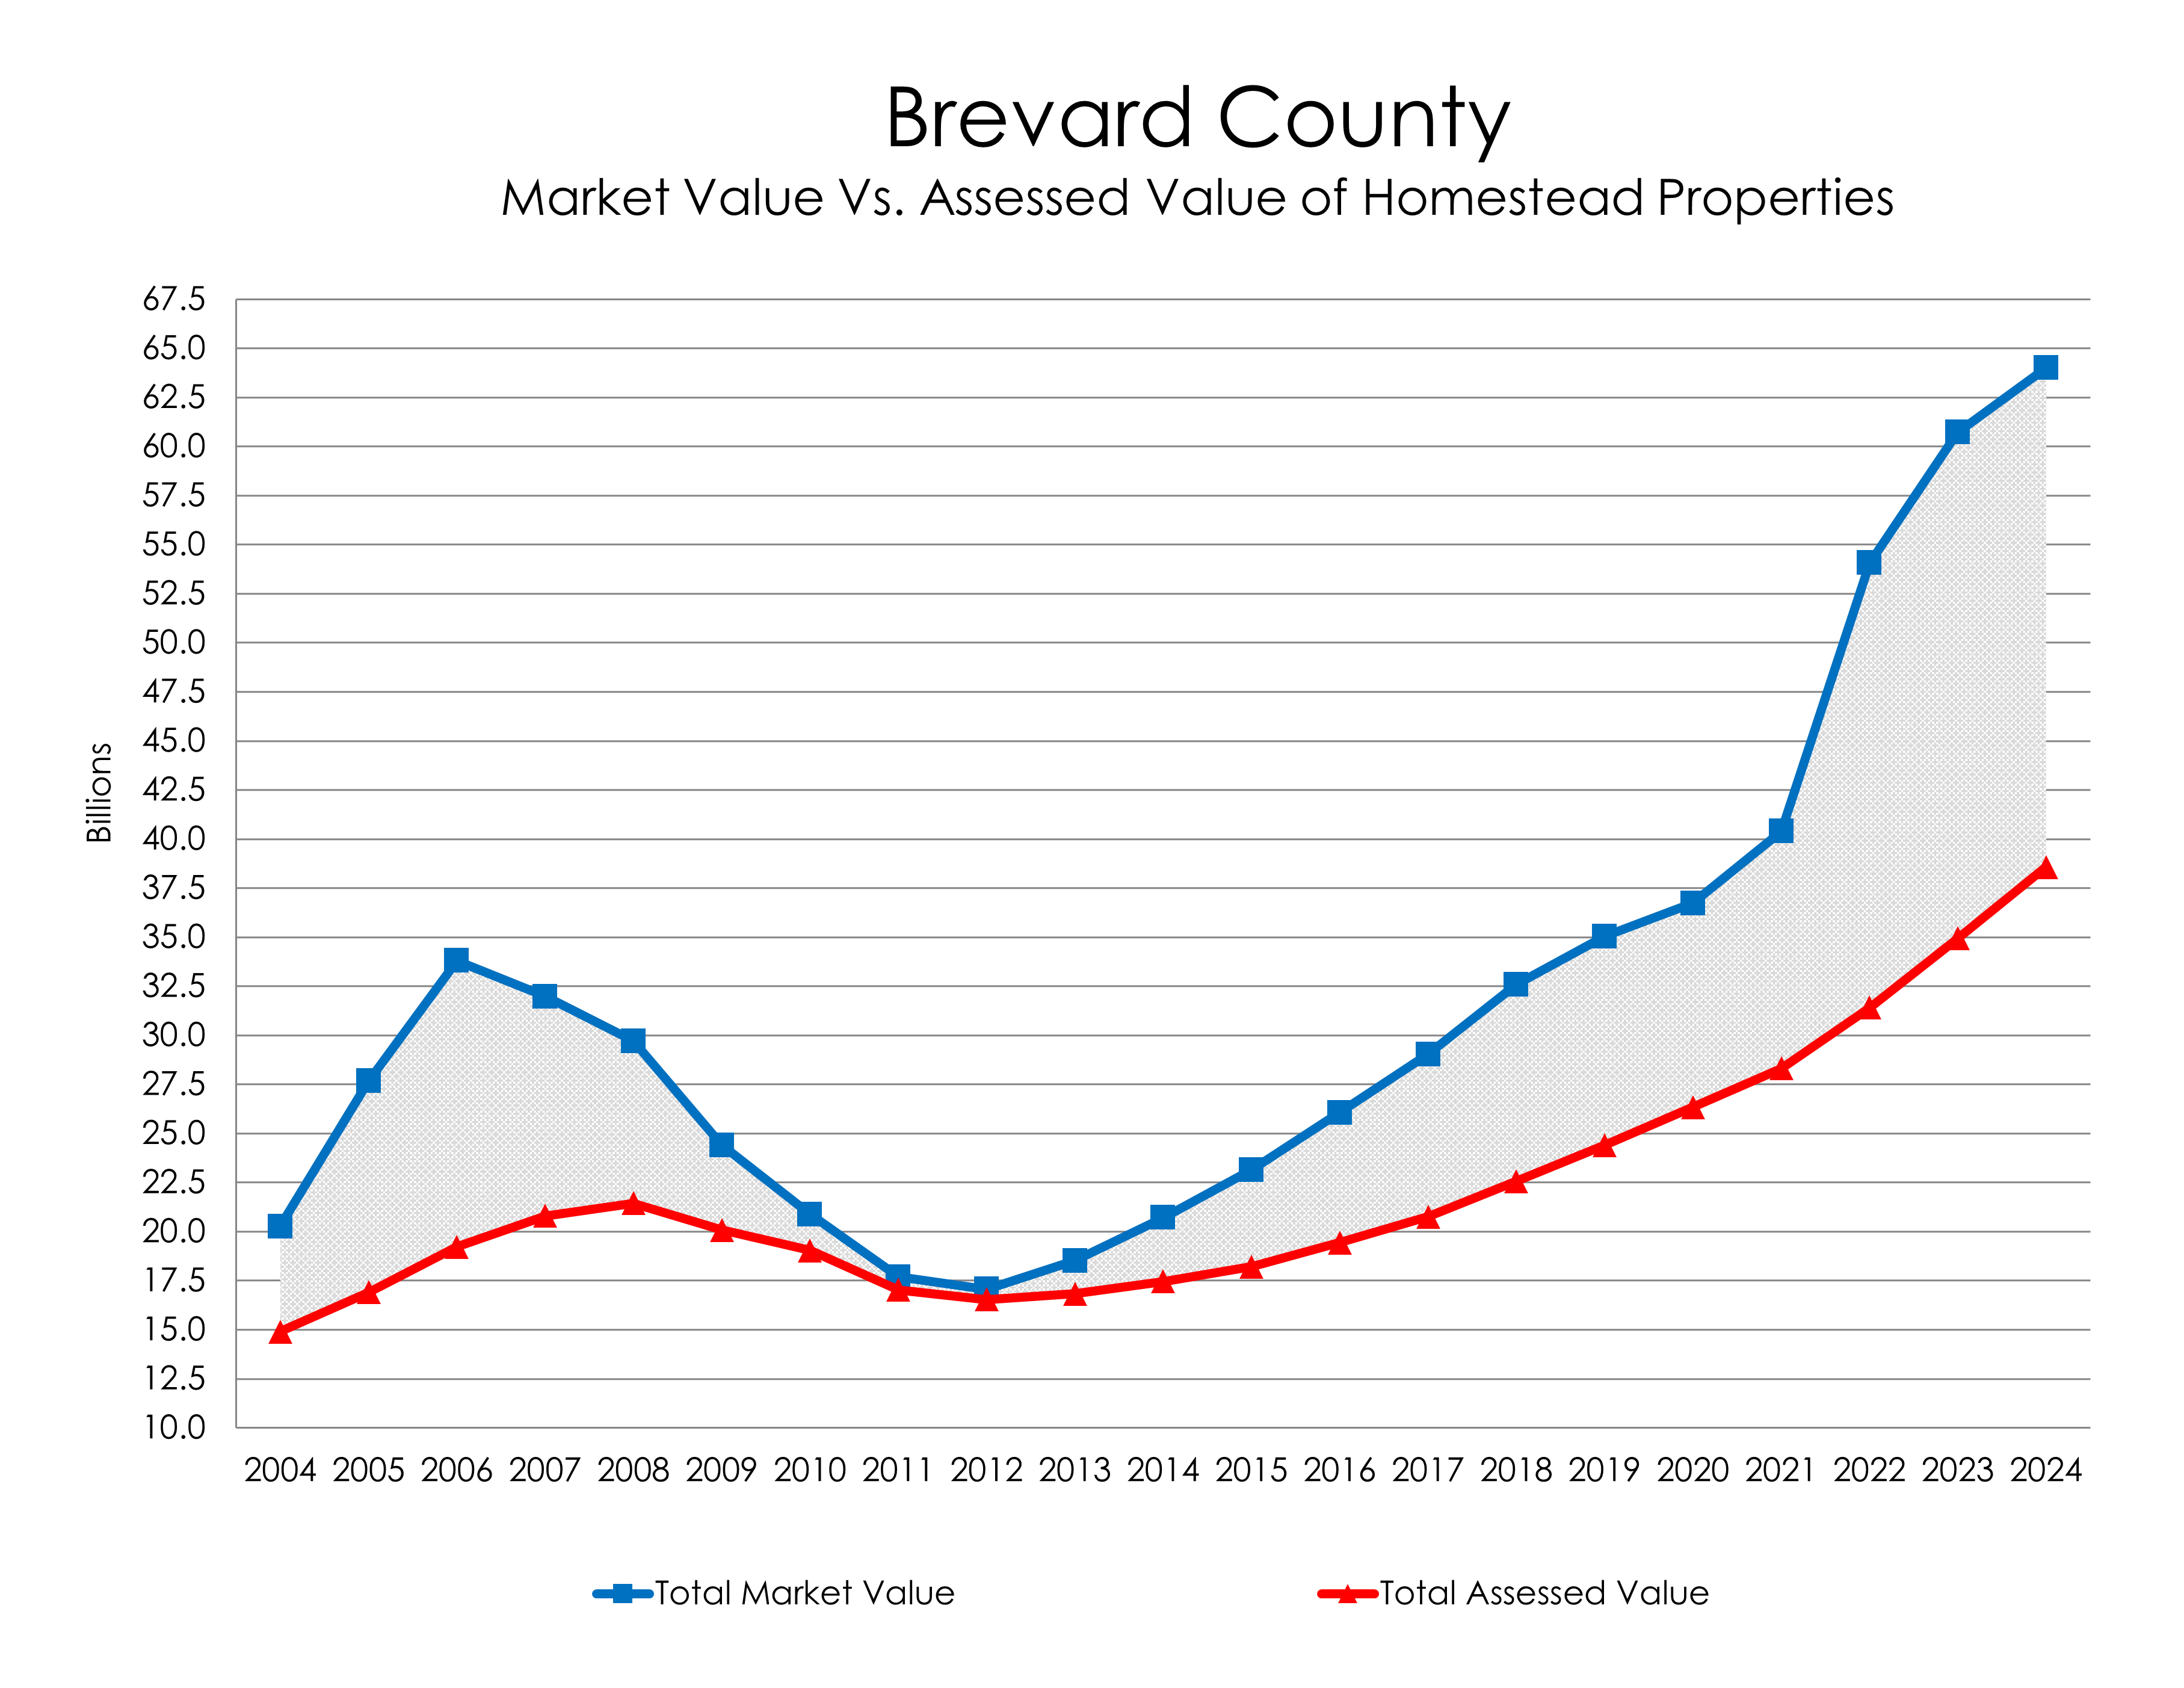
This chart shows the difference between Total Market Value and Total Assessed Value* of all properties with a Homestead Exemption (represented as a disparity gap). This difference results in ad valorem ('based on value') property tax savings. At the height of the real estate boom when market values skyrocketed, the disparity gap was over $14.5 billion, but assessed values were increasing only 3% a year. By 2012, with market values decreasing, the disparity gap closed to within a half-billion dollars. Since the 2012 low point, the chart shows another widening disparity gap.
*Assessed value is the capped market value due to Save Our Homes.
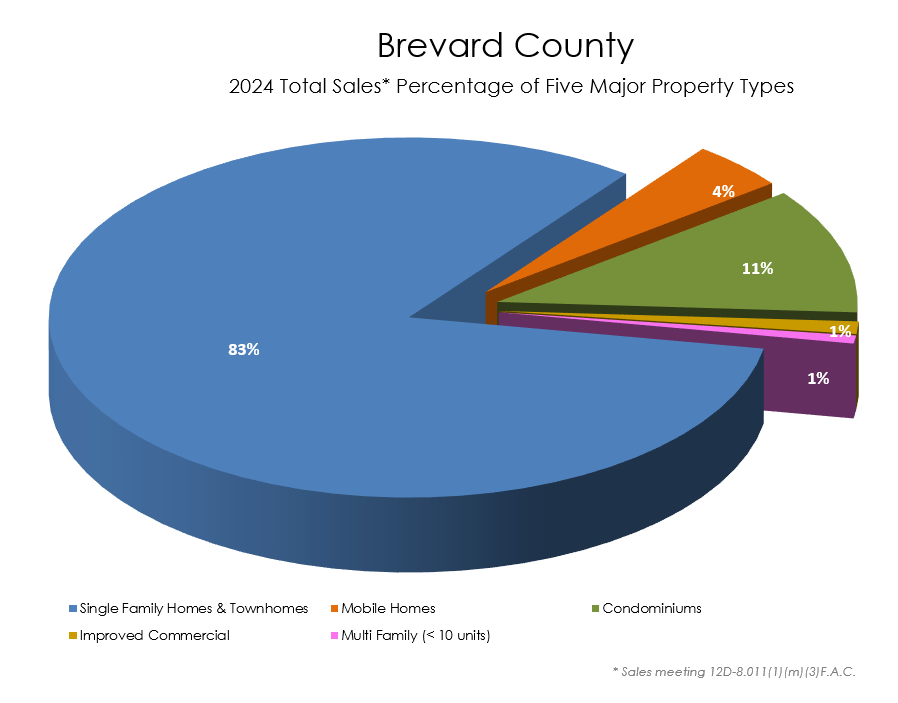 This chart shows the percentage breakdown of sales used in the Property Appraiser's development of market value for five major property types. Sales included here are actual qualified market transactions in Brevard County that meet the Florida Department of Revenue's strict requirements for assessment computations.
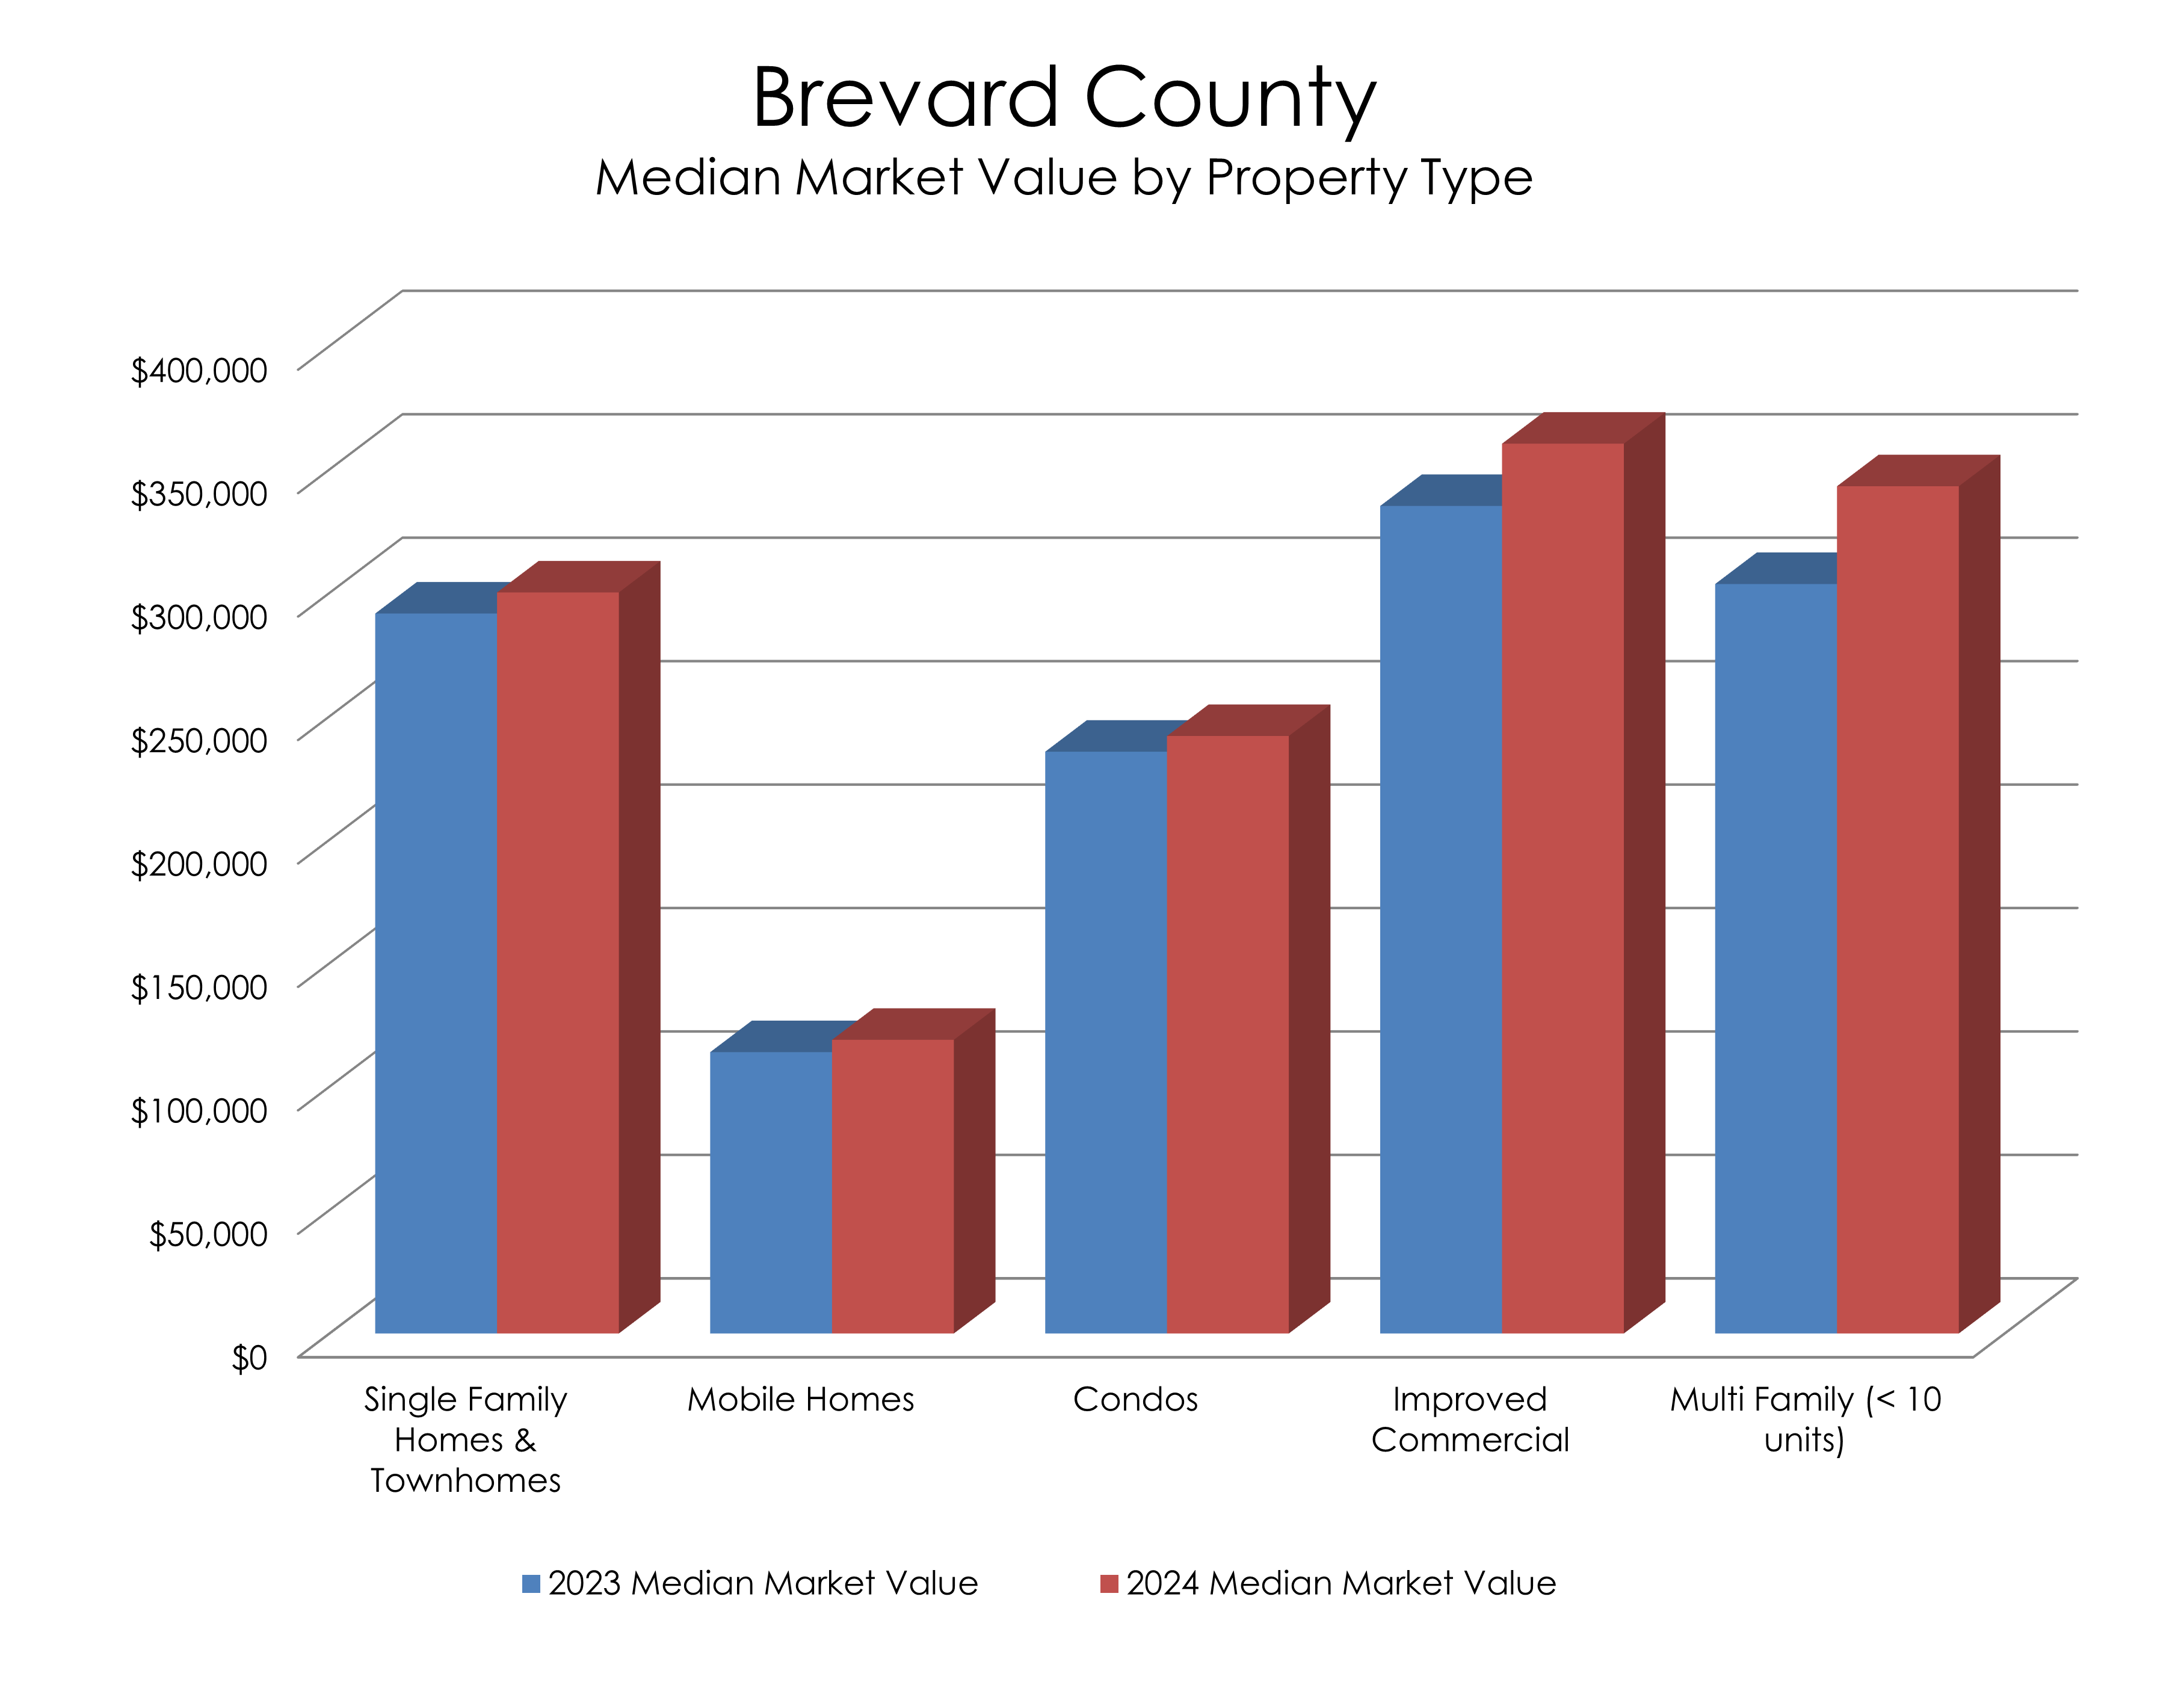 This chart compares the median market value for five major property types in Brevard County. Market value represented here is for assessment purposes and reflects total estimated net seller proceeds (expected market price less typical ownership transfer costs).
Brevard County
New Home Construction Count by Market Area
| Market Area | 2015 | 2016 | 2017 | 2018 | 2019 | 2020 | 2021 | 2022 | 2023 | 2024 | 2025 | Total |
|---|---|---|---|---|---|---|---|---|---|---|---|---|
| Canaveral Groves | 7 | 11 | 14 | 19 | 48 | 172 | 111 | 48 | 68 | 156 | 89 | 743 |
| Cape Canaveral / Cocoa Beach | 19 | 17 | 20 | 15 | 8 | 13 | 17 | 16 | 13 | 11 | 16 | 165 |
| Cocoa | 94 | 60 | 15 | 32 | 33 | 121 | 71 | 214 | 74 | 27 | 64 | 805 |
| Melbourne | 199 | 261 | 420 | 469 | 214 | 308 | 299 | 60 | 226 | 86 | 192 | 2,734 |
| Merritt Island | 47 | 40 | 114 | 87 | 66 | 117 | 121 | 82 | 78 | 103 | 142 | 997 |
| Micco | 58 | 43 | 47 | 57 | 37 | 113 | 190 | 368 | 413 | 291 | 159 | 1,776 |
| Mims / Scottsmoor | 17 | 25 | 41 | 76 | 32 | 86 | 100 | 134 | 157 | 100 | 89 | 857 |
| Northeast Melbourne | 56 | 68 | 33 | 63 | 9 | 27 | 53 | 53 | 16 | 31 | 25 | 434 |
| Palm Bay | 230 | 348 | 527 | 607 | 595 | 1,037 | 1,281 | 2,214 | 2,697 | 2,365 | 2,098 | 13,999 |
| Port St. John | 9 | 12 | 39 | 58 | 42 | 57 | 31 | 23 | 29 | 32 | 34 | 366 |
| Rockledge | 46 | 60 | 101 | 57 | 14 | 50 | 25 | 56 | 192 | 207 | 8 | 816 |
| South Beaches | 76 | 92 | 79 | 95 | 68 | 121 | 92 | 80 | 76 | 60 | 37 | 876 |
| Titusville | 79 | 103 | 127 | 86 | 64 | 148 | 152 | 108 | 185 | 229 | 202 | 1,483 |
| Turtlemound | 33 | 89 | 126 | 80 | 29 | 25 | 30 | 37 | 36 | 19 | 11 | 515 |
| Viera / Suntree | 471 | 378 | 435 | 619 | 446 | 589 | 520 | 586 | 878 | 688 | 775 | 6,385 |
| Yearly Total for All Market Areas | 1,441 | 1,607 | 2,138 | 2,420 | 1,705 | 2,984 | 3,093 | 4,079 | 5,138 | 4,405 | 3,941 | 32,951 |
Includes property use codes 0110 Single Family, 0135 Townhouse, and 0121 Half Duplex used as single-family home.
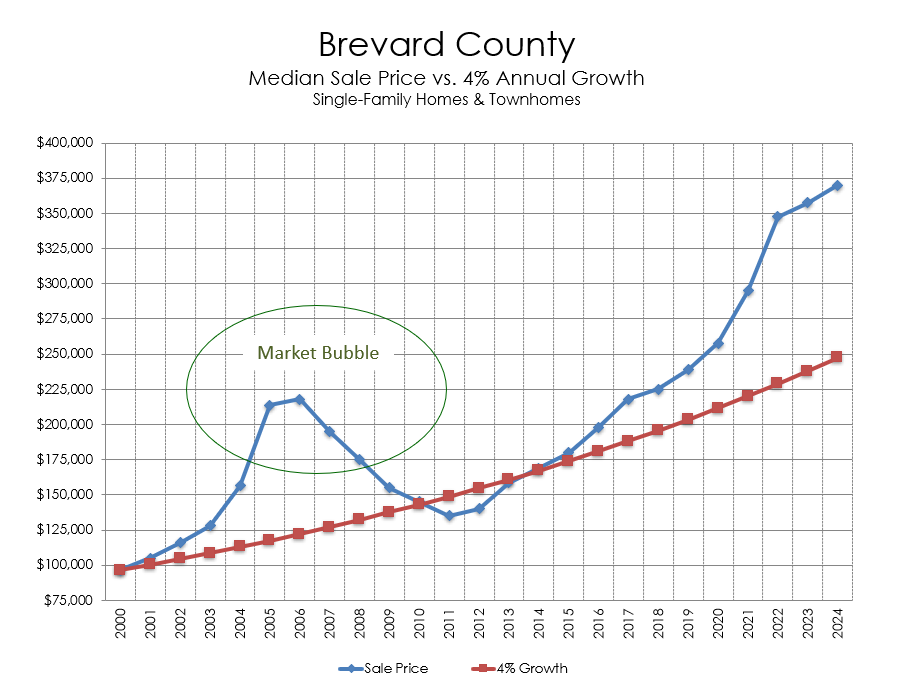 This chart compares a steady 5% annual growth line to Median Home Sale Prices, revealing the market bubble, subsequent correction, and current upward trend.
Brevard County
Property Type Counts by Market Area
| Market Area |
Single Family |
Multi Family |
Agricultural | Vacant Residential |
Vacant Commercial |
Improved Commercial |
Government Institutional Other |
|---|---|---|---|---|---|---|---|
| Canaveral Groves | 5,257 | 70 | 43 | 3,758 | 255 | 321 | 872 |
| Cape Canaveral / Cocoa Beach | 16,889 | 522 | 0 | 283 | 64 | 970 | 307 |
| Cocoa | 11,145 | 383 | 60 | 953 | 405 | 871 | 512 |
| Melbourne | 26,843 | 490 | 62 | 1,653 | 660 | 2,174 | 950 |
| Merritt Island | 18,954 | 184 | 164 | 1,052 | 285 | 746 | 438 |
| Micco | 13,374 | 131 | 265 | 4,920 | 444 | 310 | 2,627 |
| Mims / Scottsmoore | 5,838 | 74 | 572 | 2,988 | 307 | 157 | 505 |
| Northeast Melbourne | 15,170 | 385 | 5 | 325 | 194 | 826 | 289 |
| Palm Bay | 48,171 | 105 | 33 | 23,449 | 289 | 315 | 780 |
| Port St. John | 9,725 | 9 | 3 | 560 | 43 | 108 | 68 |
| Rockledge | 11,300 | 145 | 8 | 270 | 163 | 562 | 242 |
| South Beaches | 25,867 | 412 | 4 | 648 | 71 | 652 | 517 |
| The Great Outdoors | 1,625 | 0 | 0 | 125 | 10 | 38 | 27 |
| Titusville | 23,055 | 383 | 19 | 2,262 | 490 | 1,010 | 869 |
| Turtlemound | 6,215 | 40 | 29 | 285 | 87 | 278 | 110 |
| Viera / Suntree | 26,345 | 25 | 31 | 2,611 | 378 | 712 | 410 |
| West Brevard | 9 | 2 | 354 | 2,180 | 76 | 7 | 1,100 |
| Total by Property Type | 265,782 | 3,360 | 1,652 | 48,322 | 4,221 | 10,057 | 10,623 |
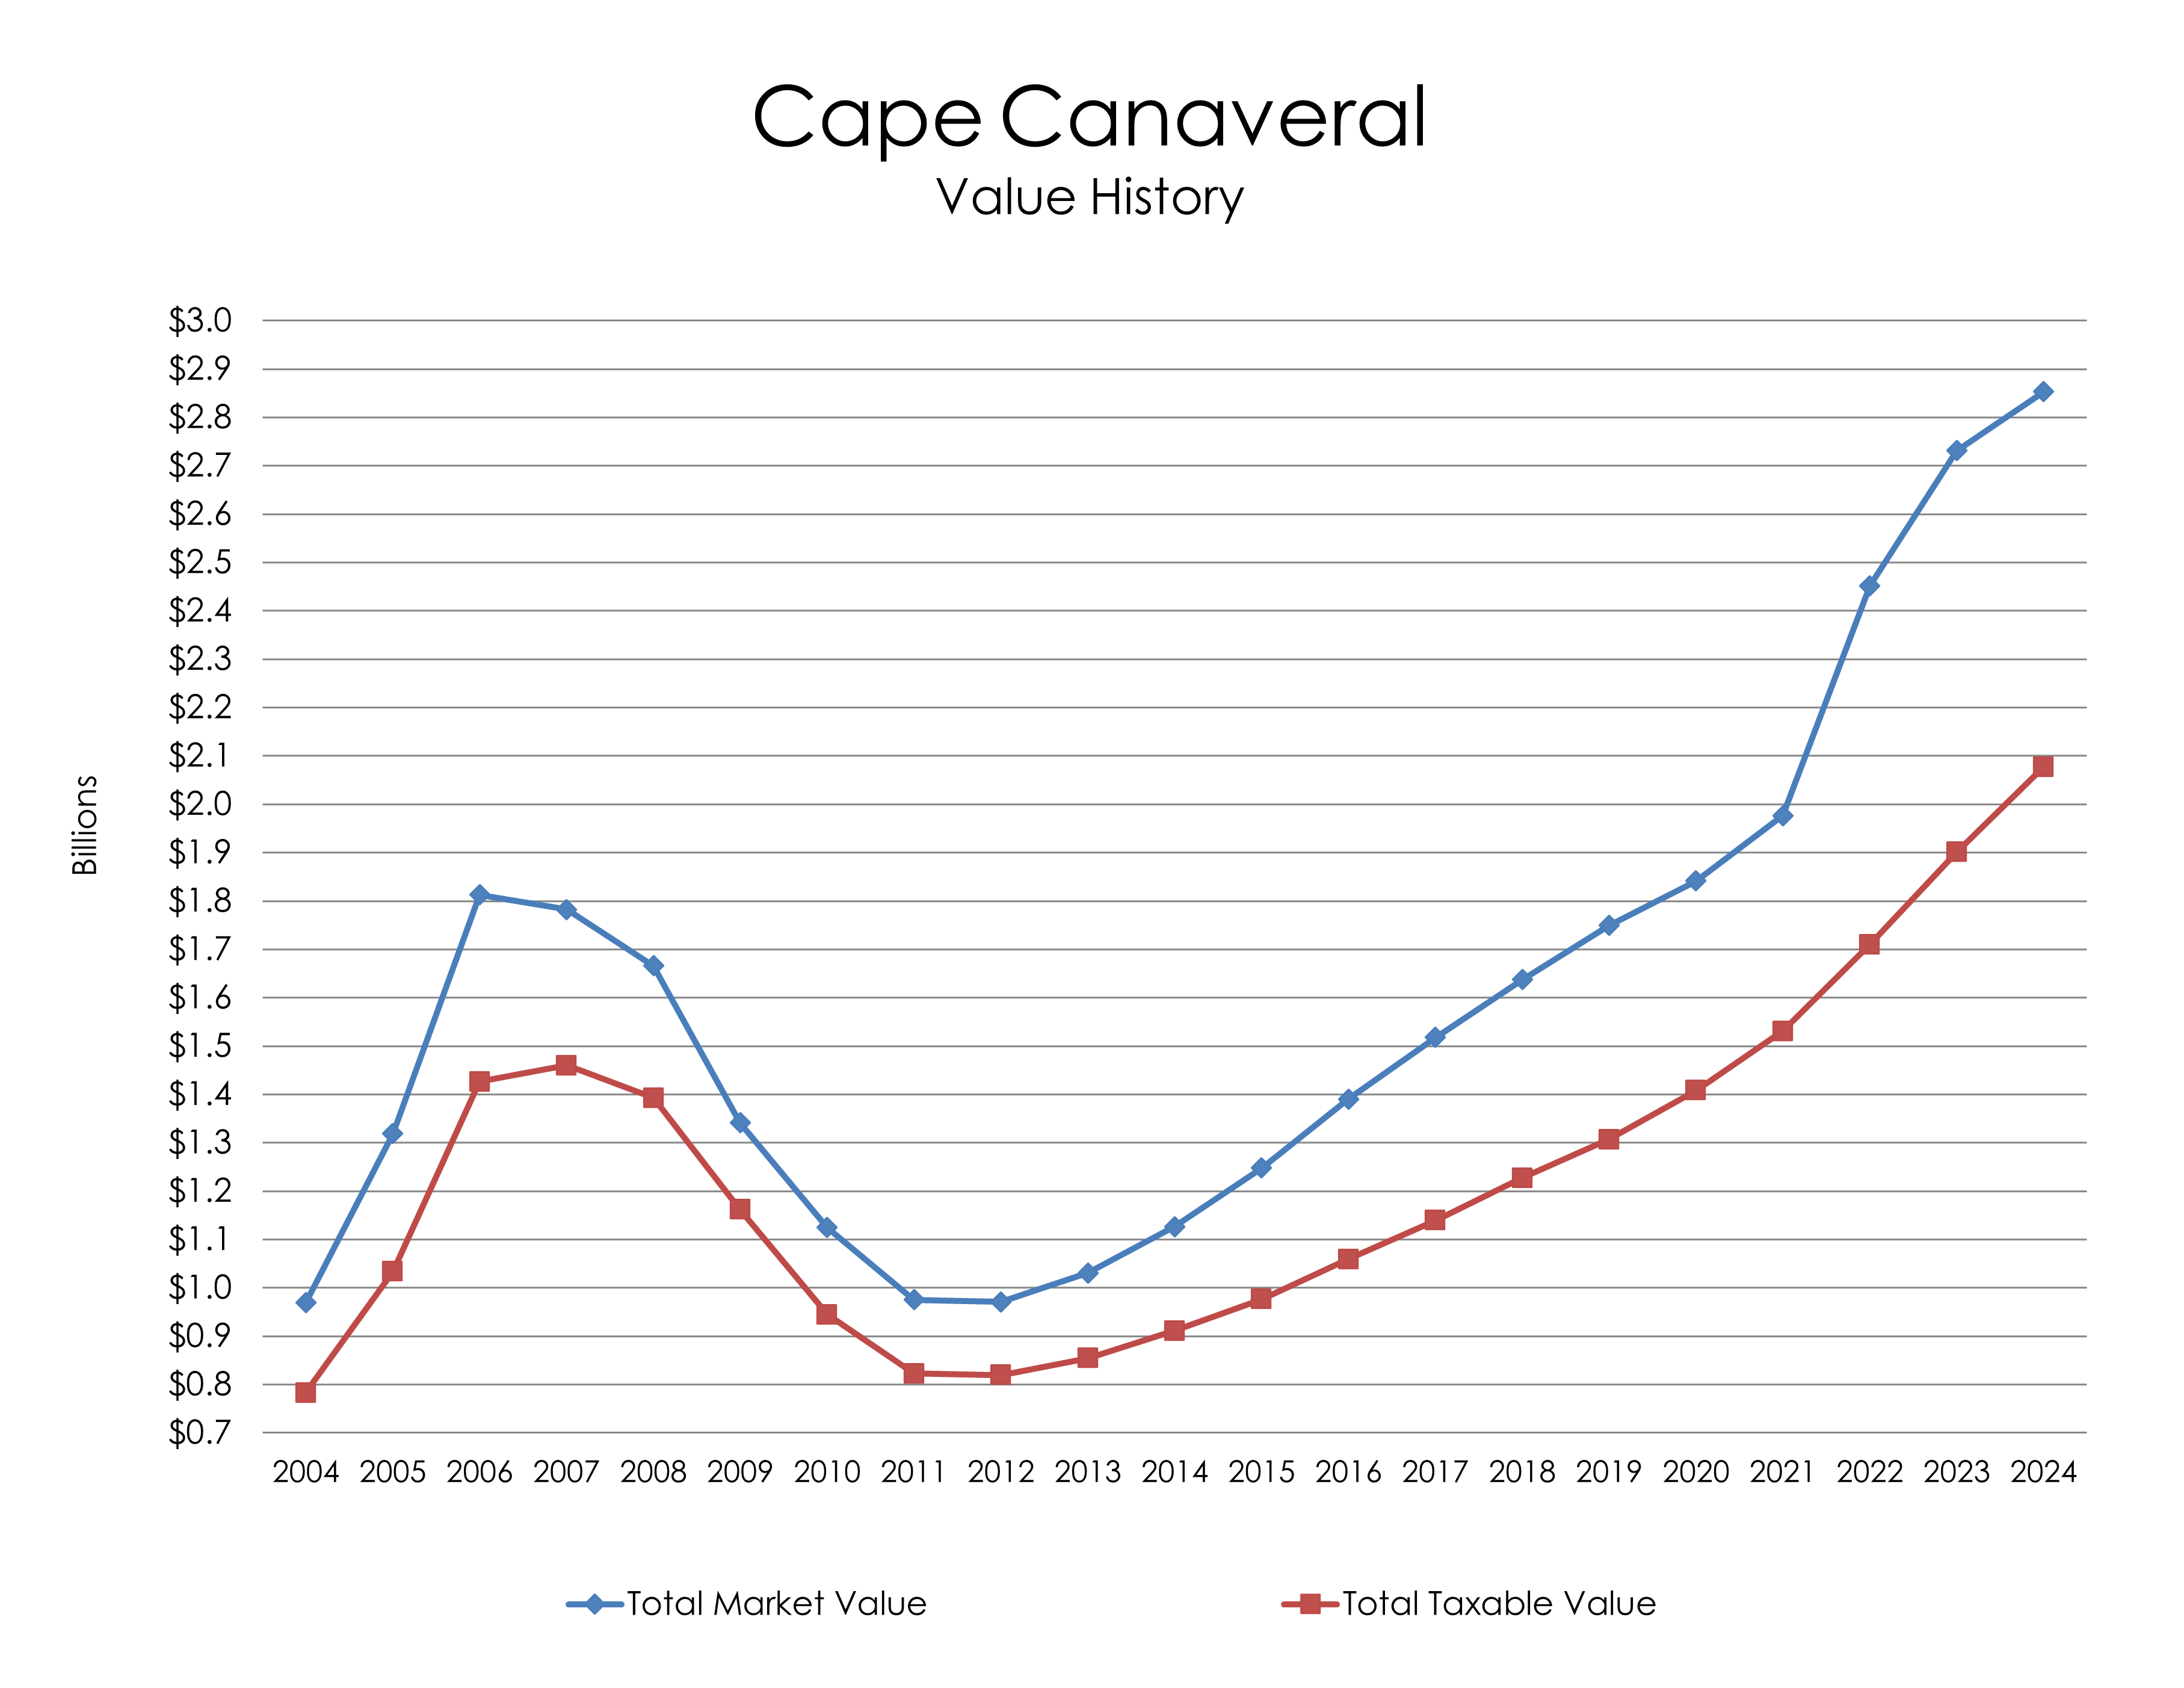 This chart shows how the City of Cape Canaveral's Total Market Value rose rapidly from 2004 to 2006, but gradually tapered off until plunging as the real estate market bubble burst. Recovery began in 2012 and has continued ever since. Total Taxable Value followed the same pattern but with slower increases.
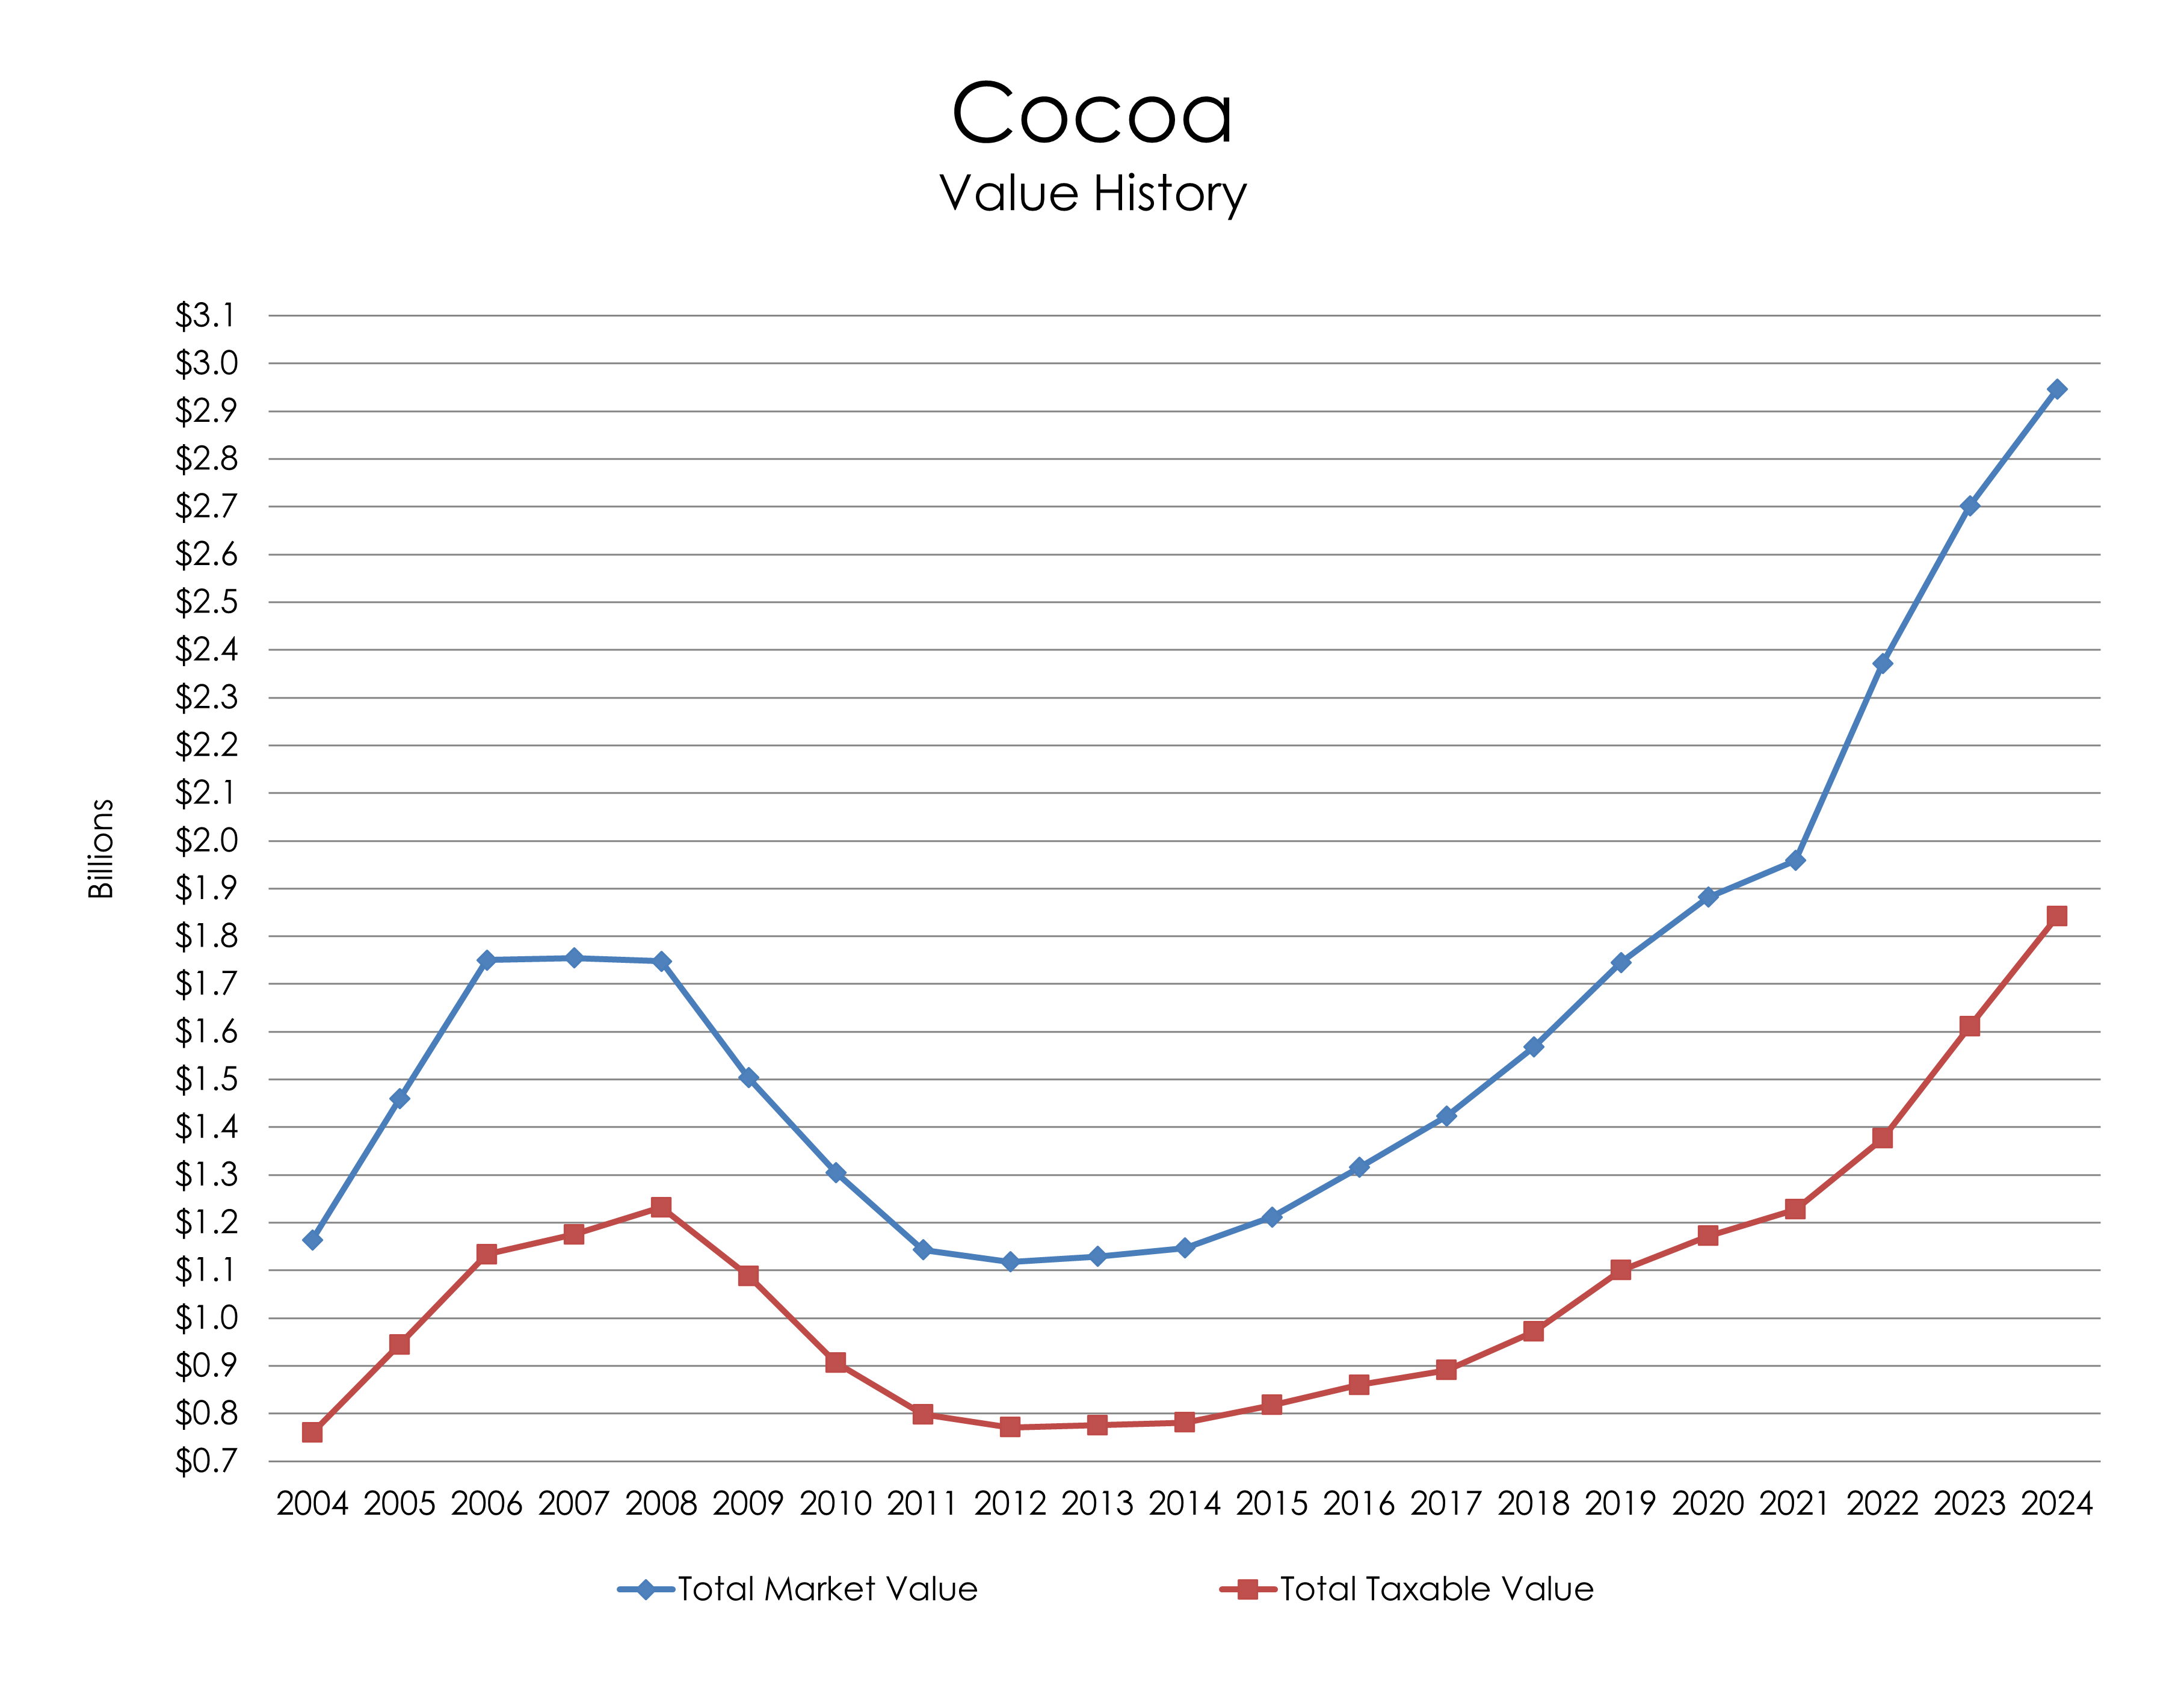 This chart shows how the City of Cocoa's Total Market Value followed the 2005-2008 real estate boom and subsequent bubble burst. Total Taxable Value also reached a high point during this time, and declined rapidly as market values plunged.
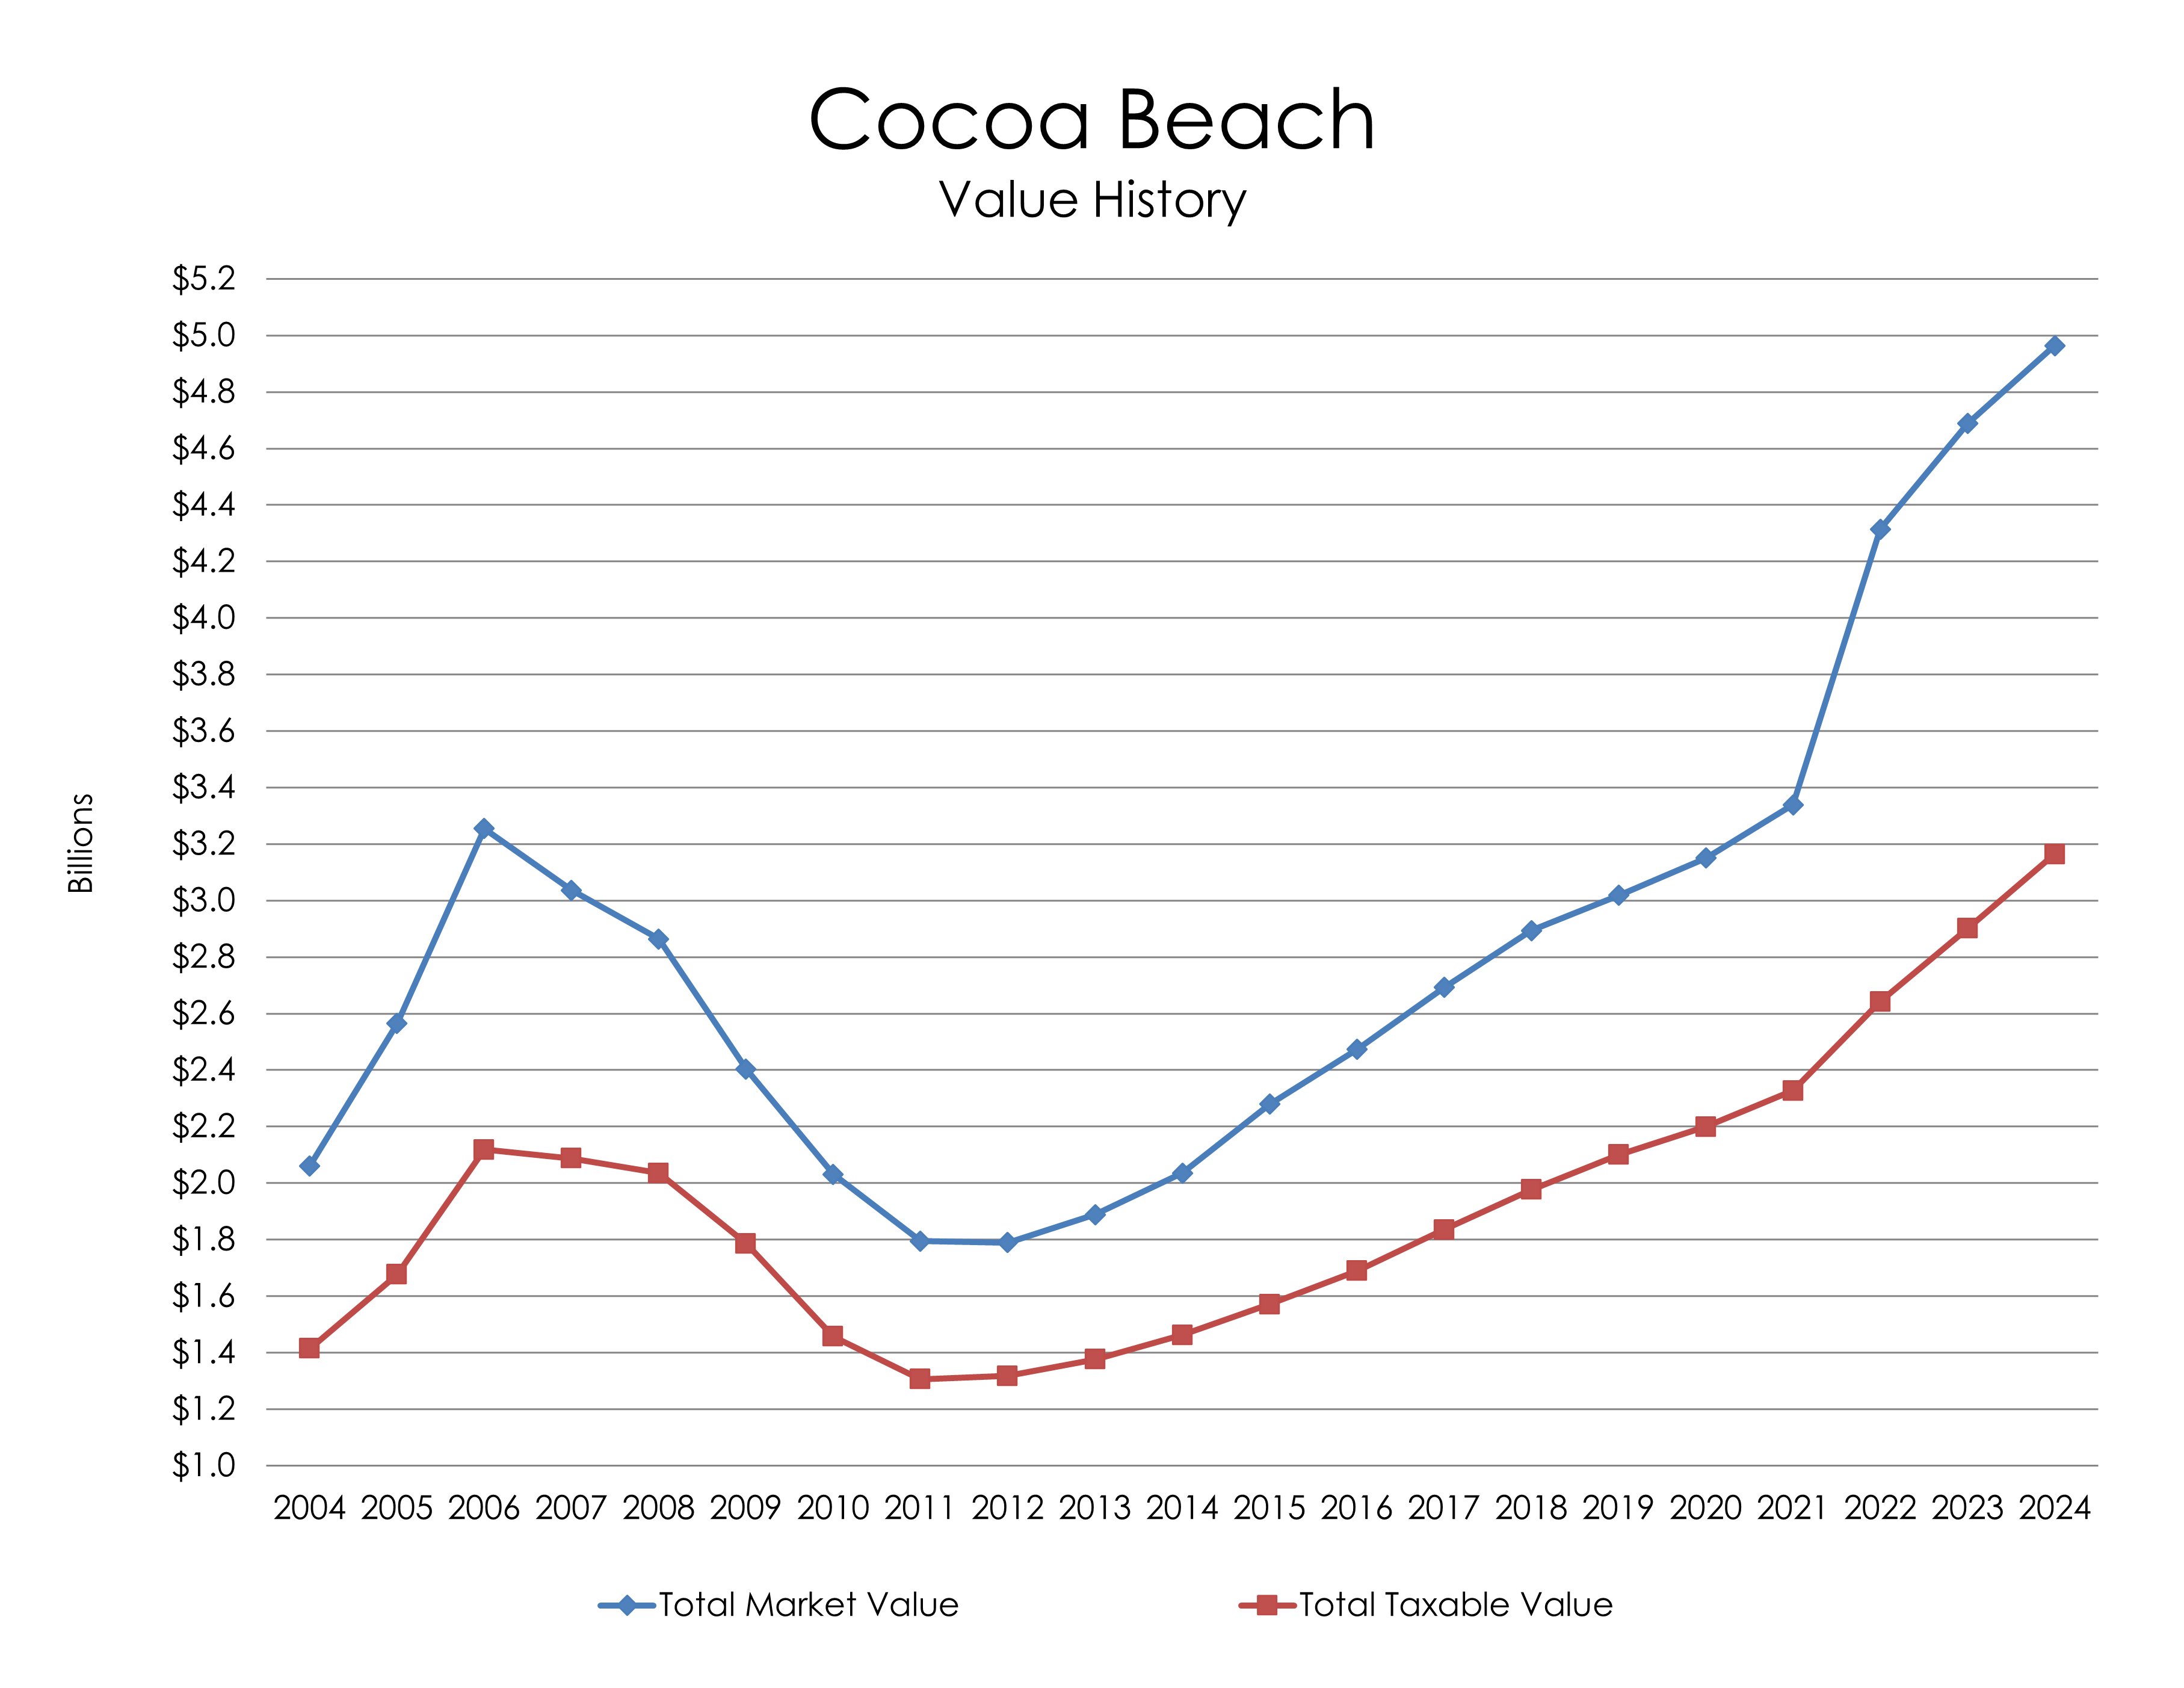 This chart shows how the City of Cocoa Beach's Total Market Value rose rapidly from 2004 to 2006, but quickly dropped soon after until recovering after 2012. Total Taxable Value also reached a high point during this time, and declined rapidly as market values plunged.
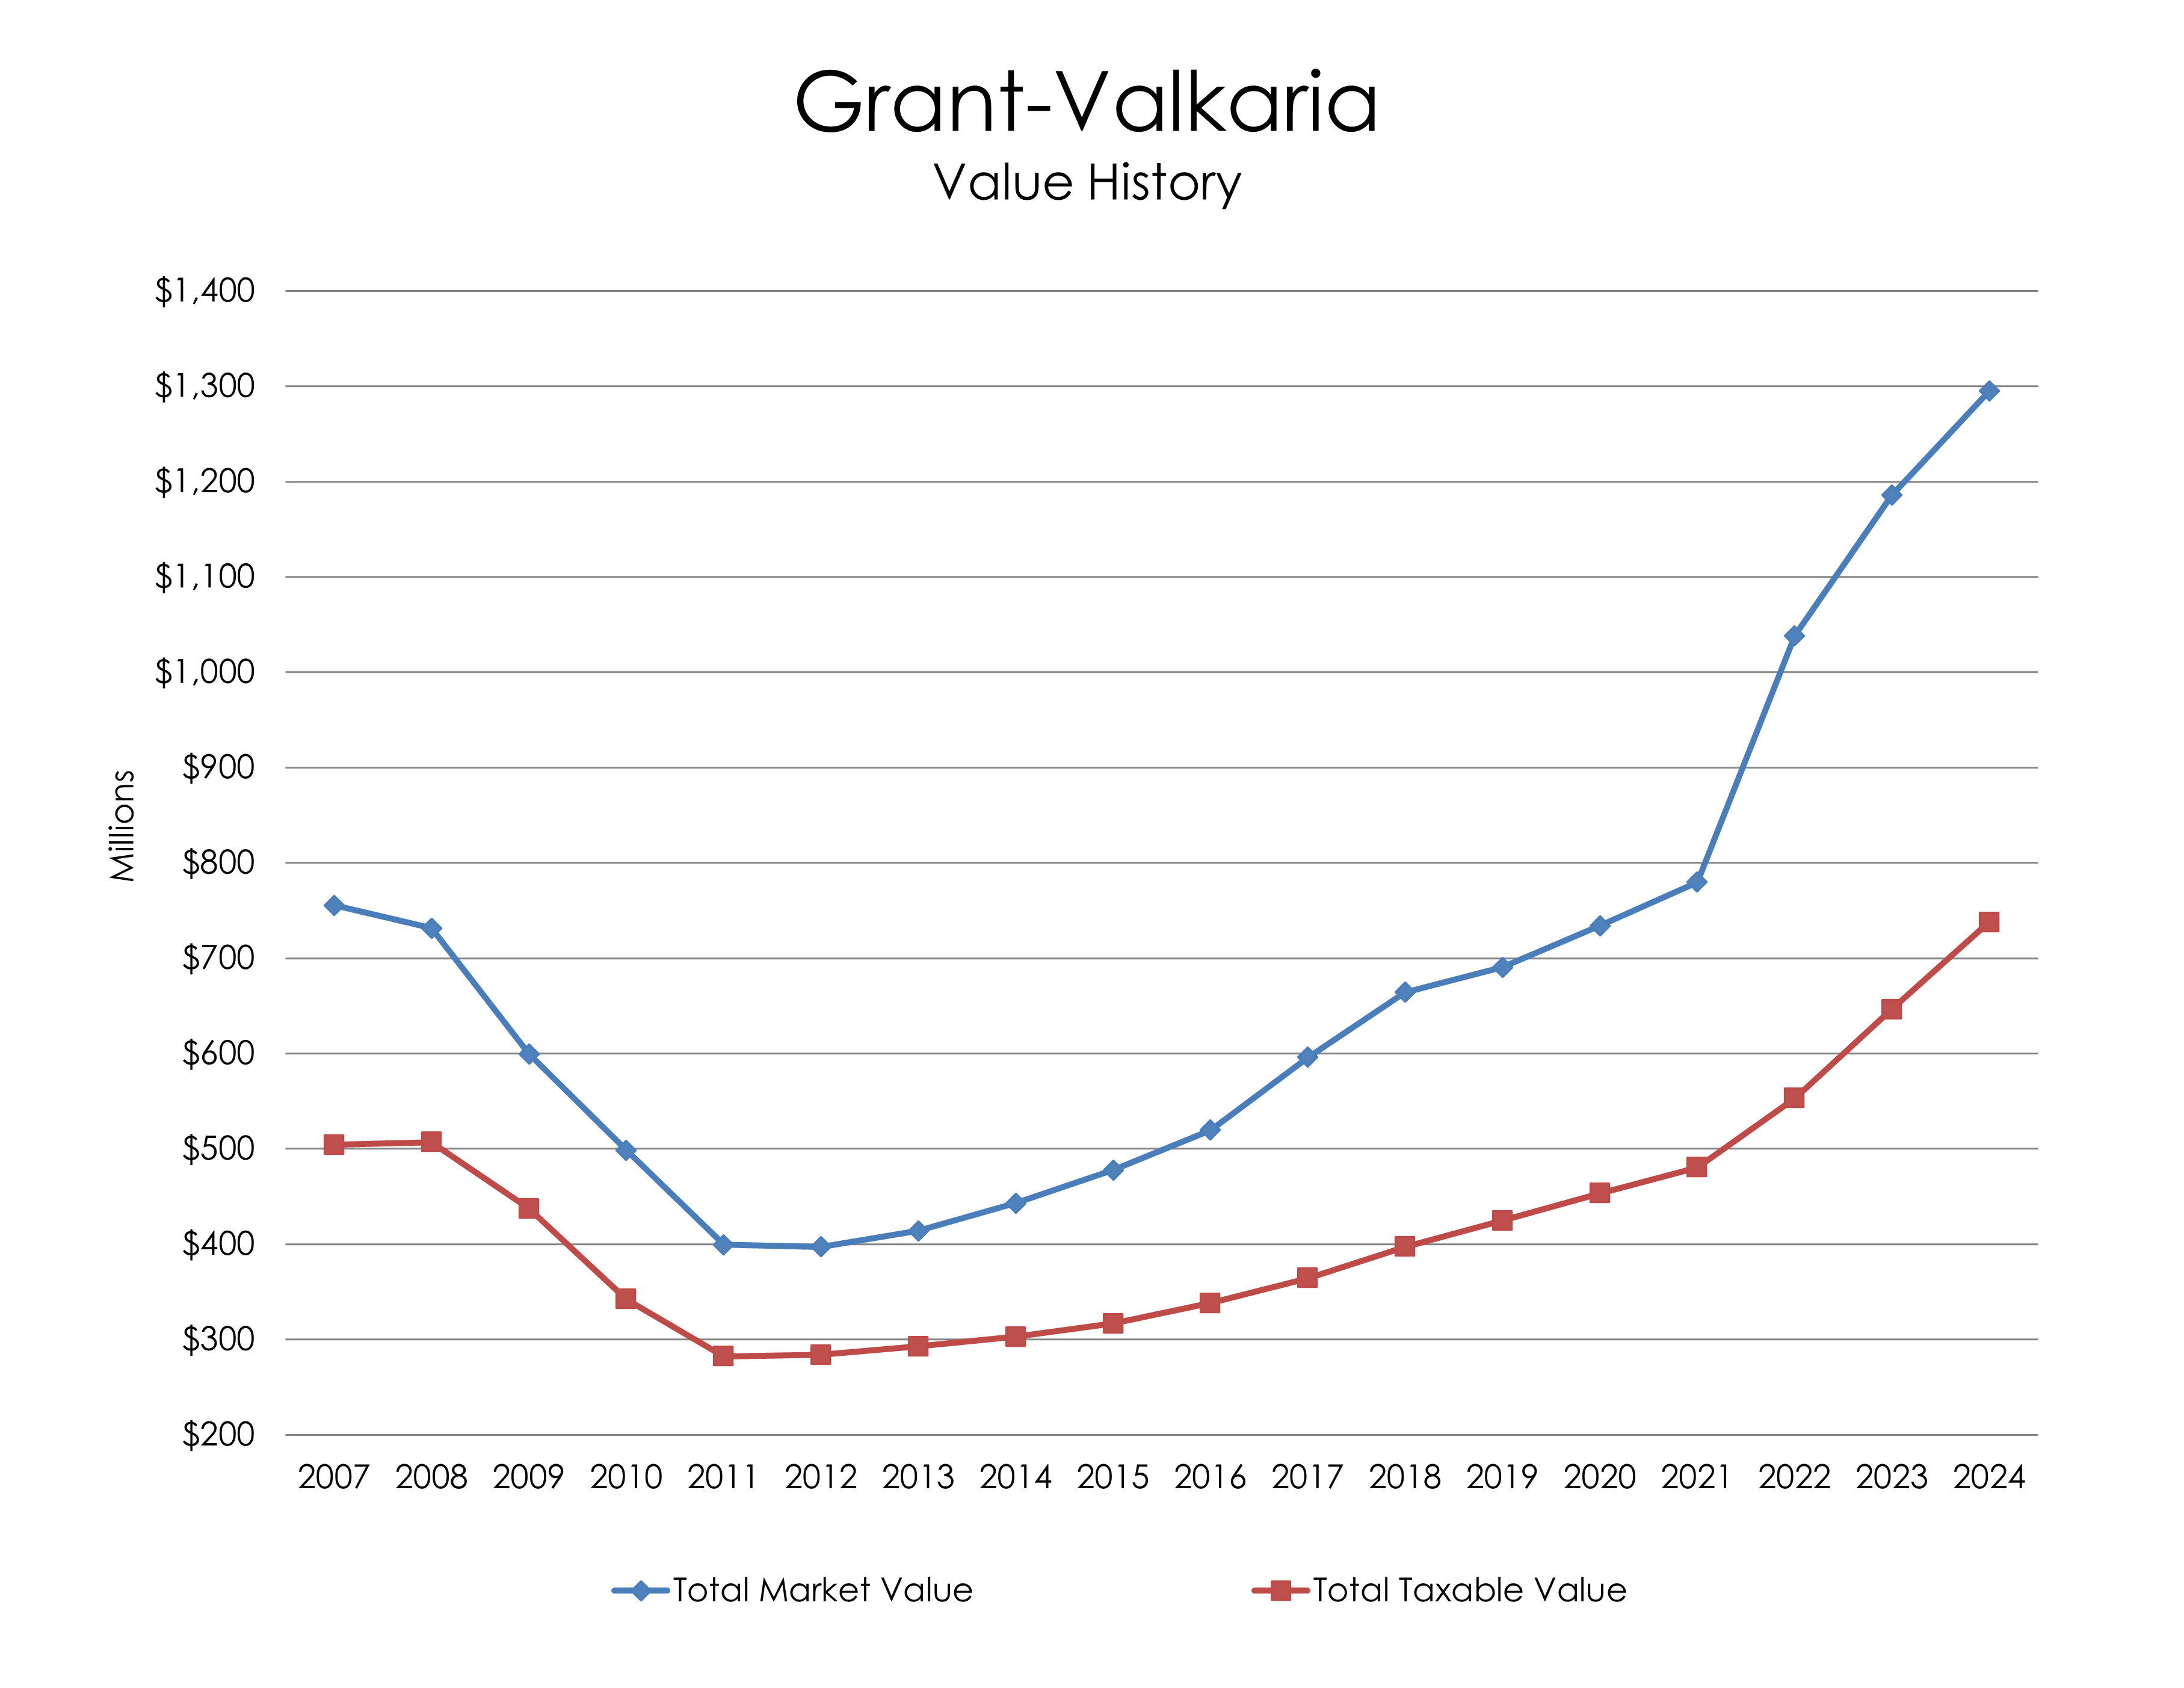 This chart shows the familiar decline in Market Value after the earlier real estate boom for the Town of Grant-Valkaria since 2007 (the first tax-roll year following the July 2006 incorporation of the villages of Grant and Valkaria that created the Town of Grant-Valkaria). Total Taxable Value also reached a high point during this time, and declined rapidly as market values plunged.
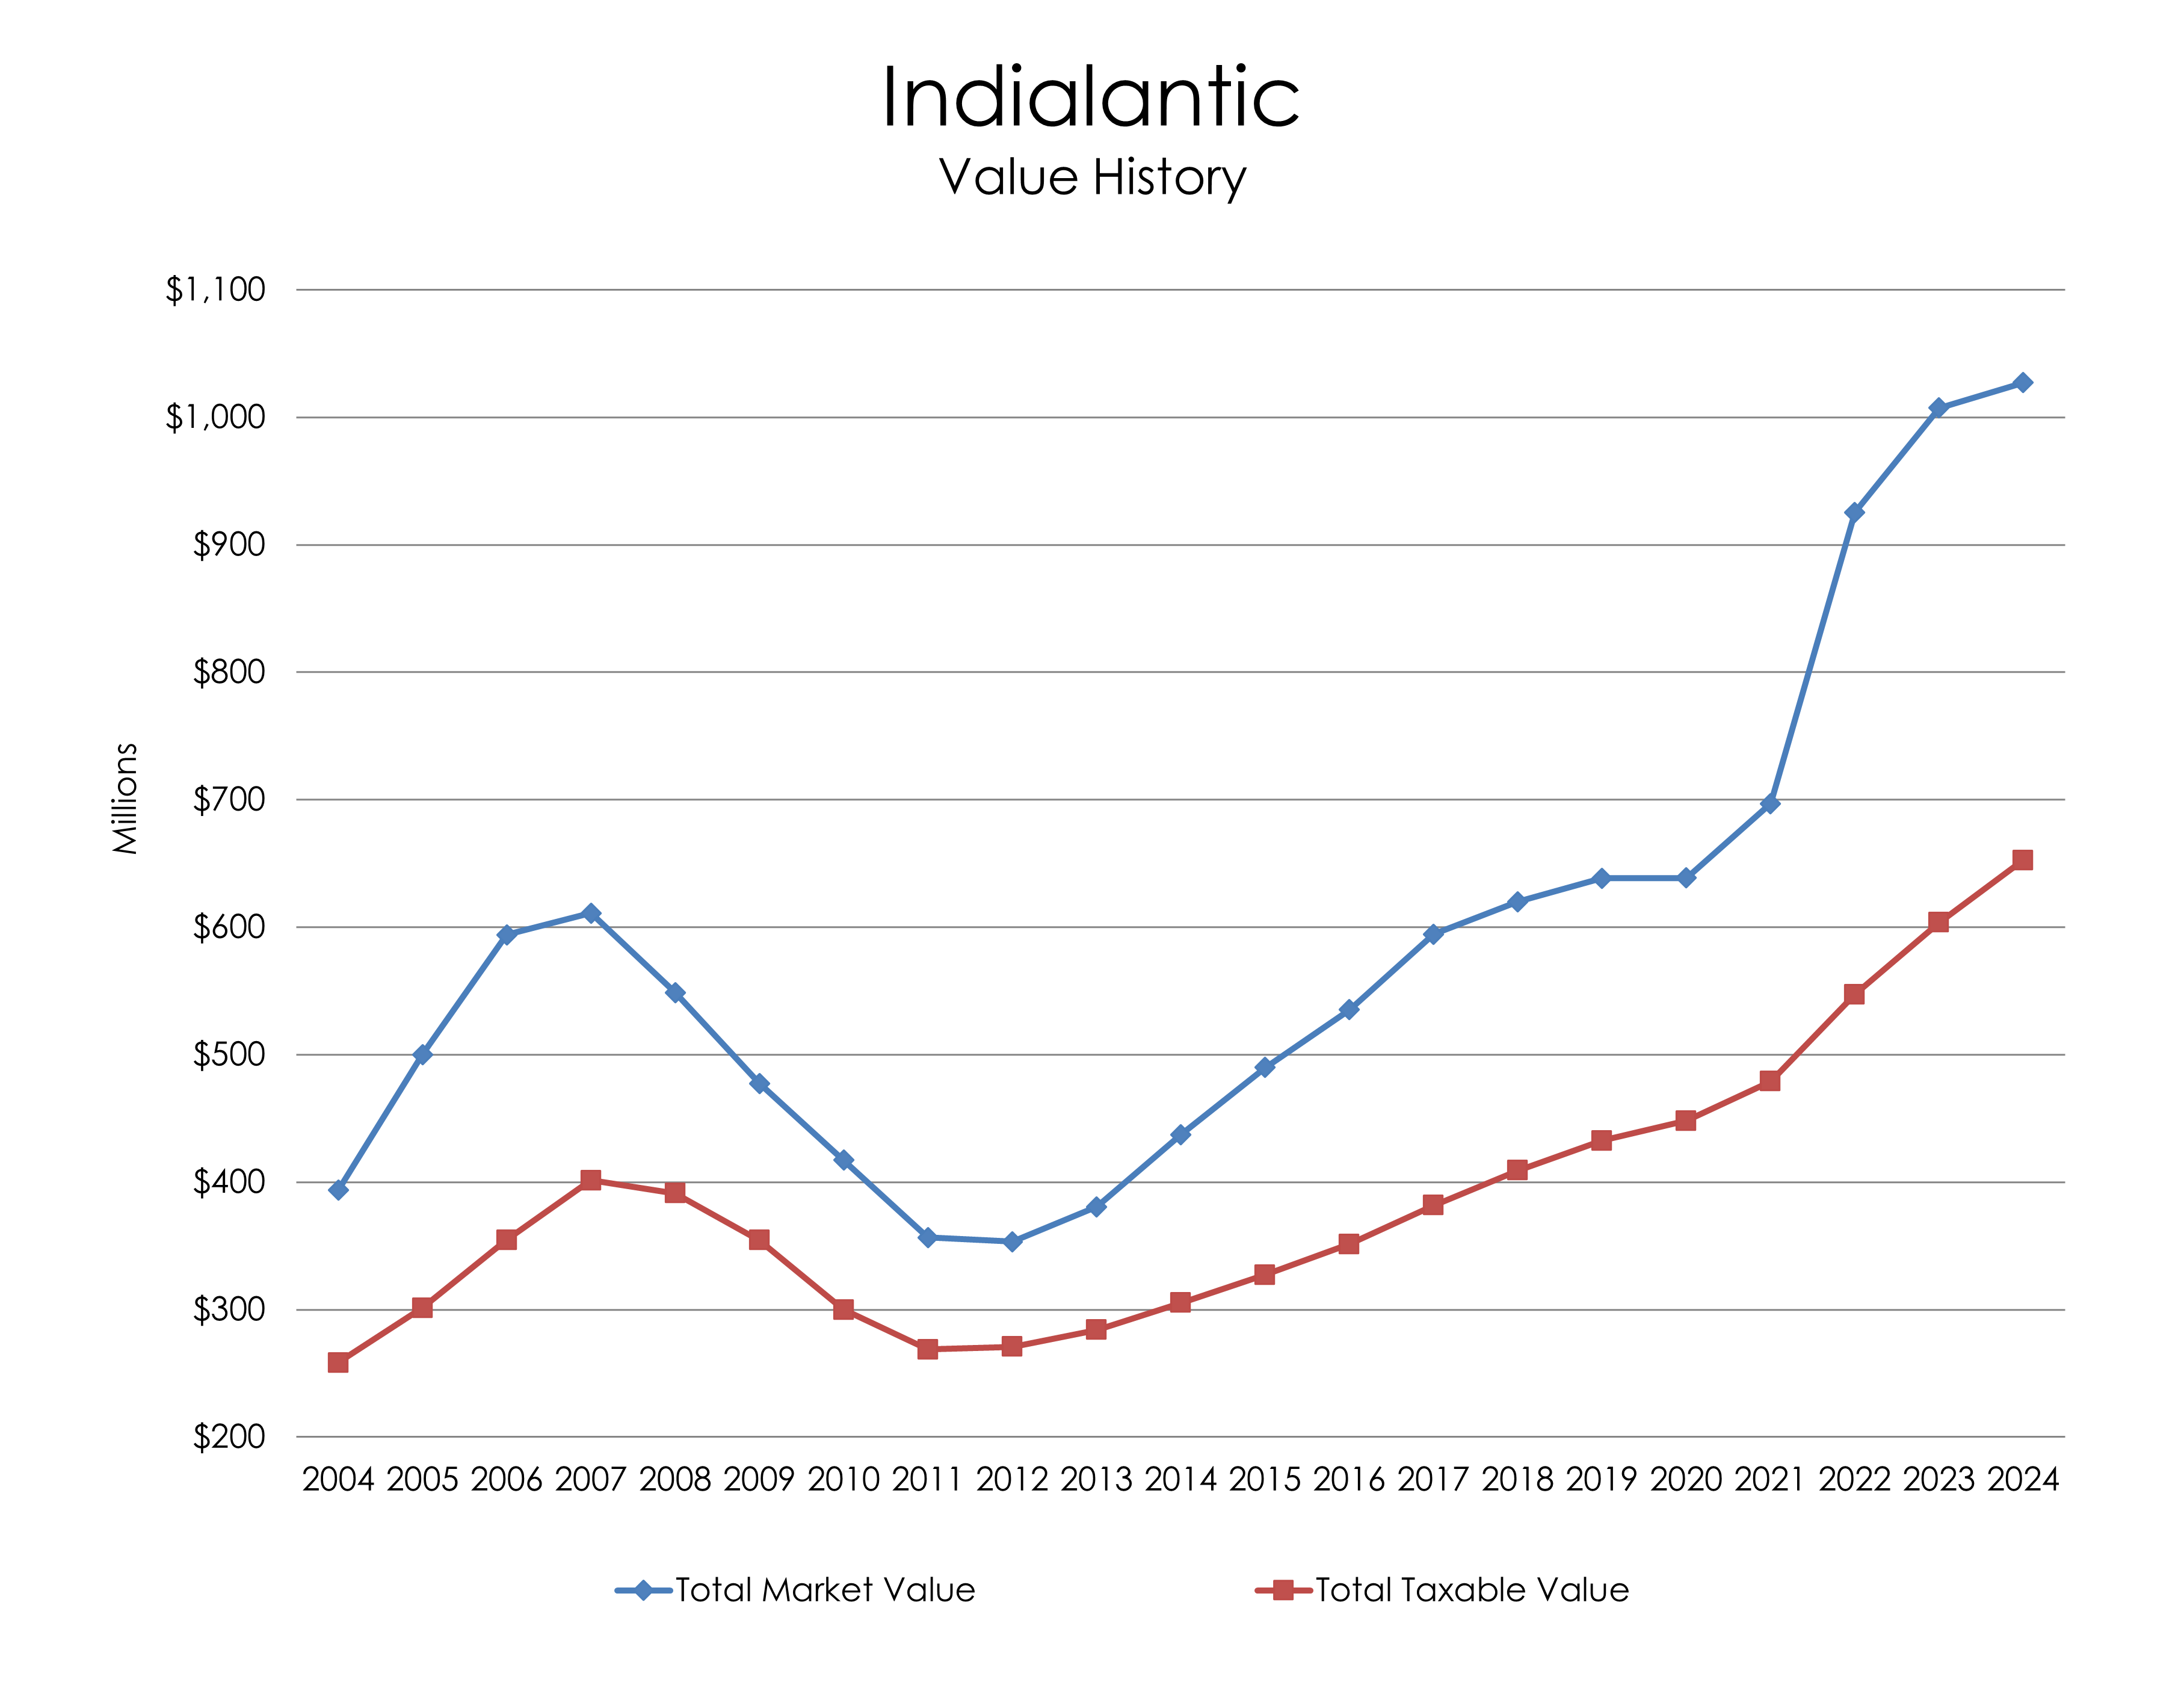 This chart shows how the Town of Indialantic's Total Market Value rose rapidly from 2004 to 2006 and continued to rise in 2007, but quickly dropped soon after until recovering after 2012. Total Taxable Value also reached a high point during this time, and declined rapidly as market values plunged.
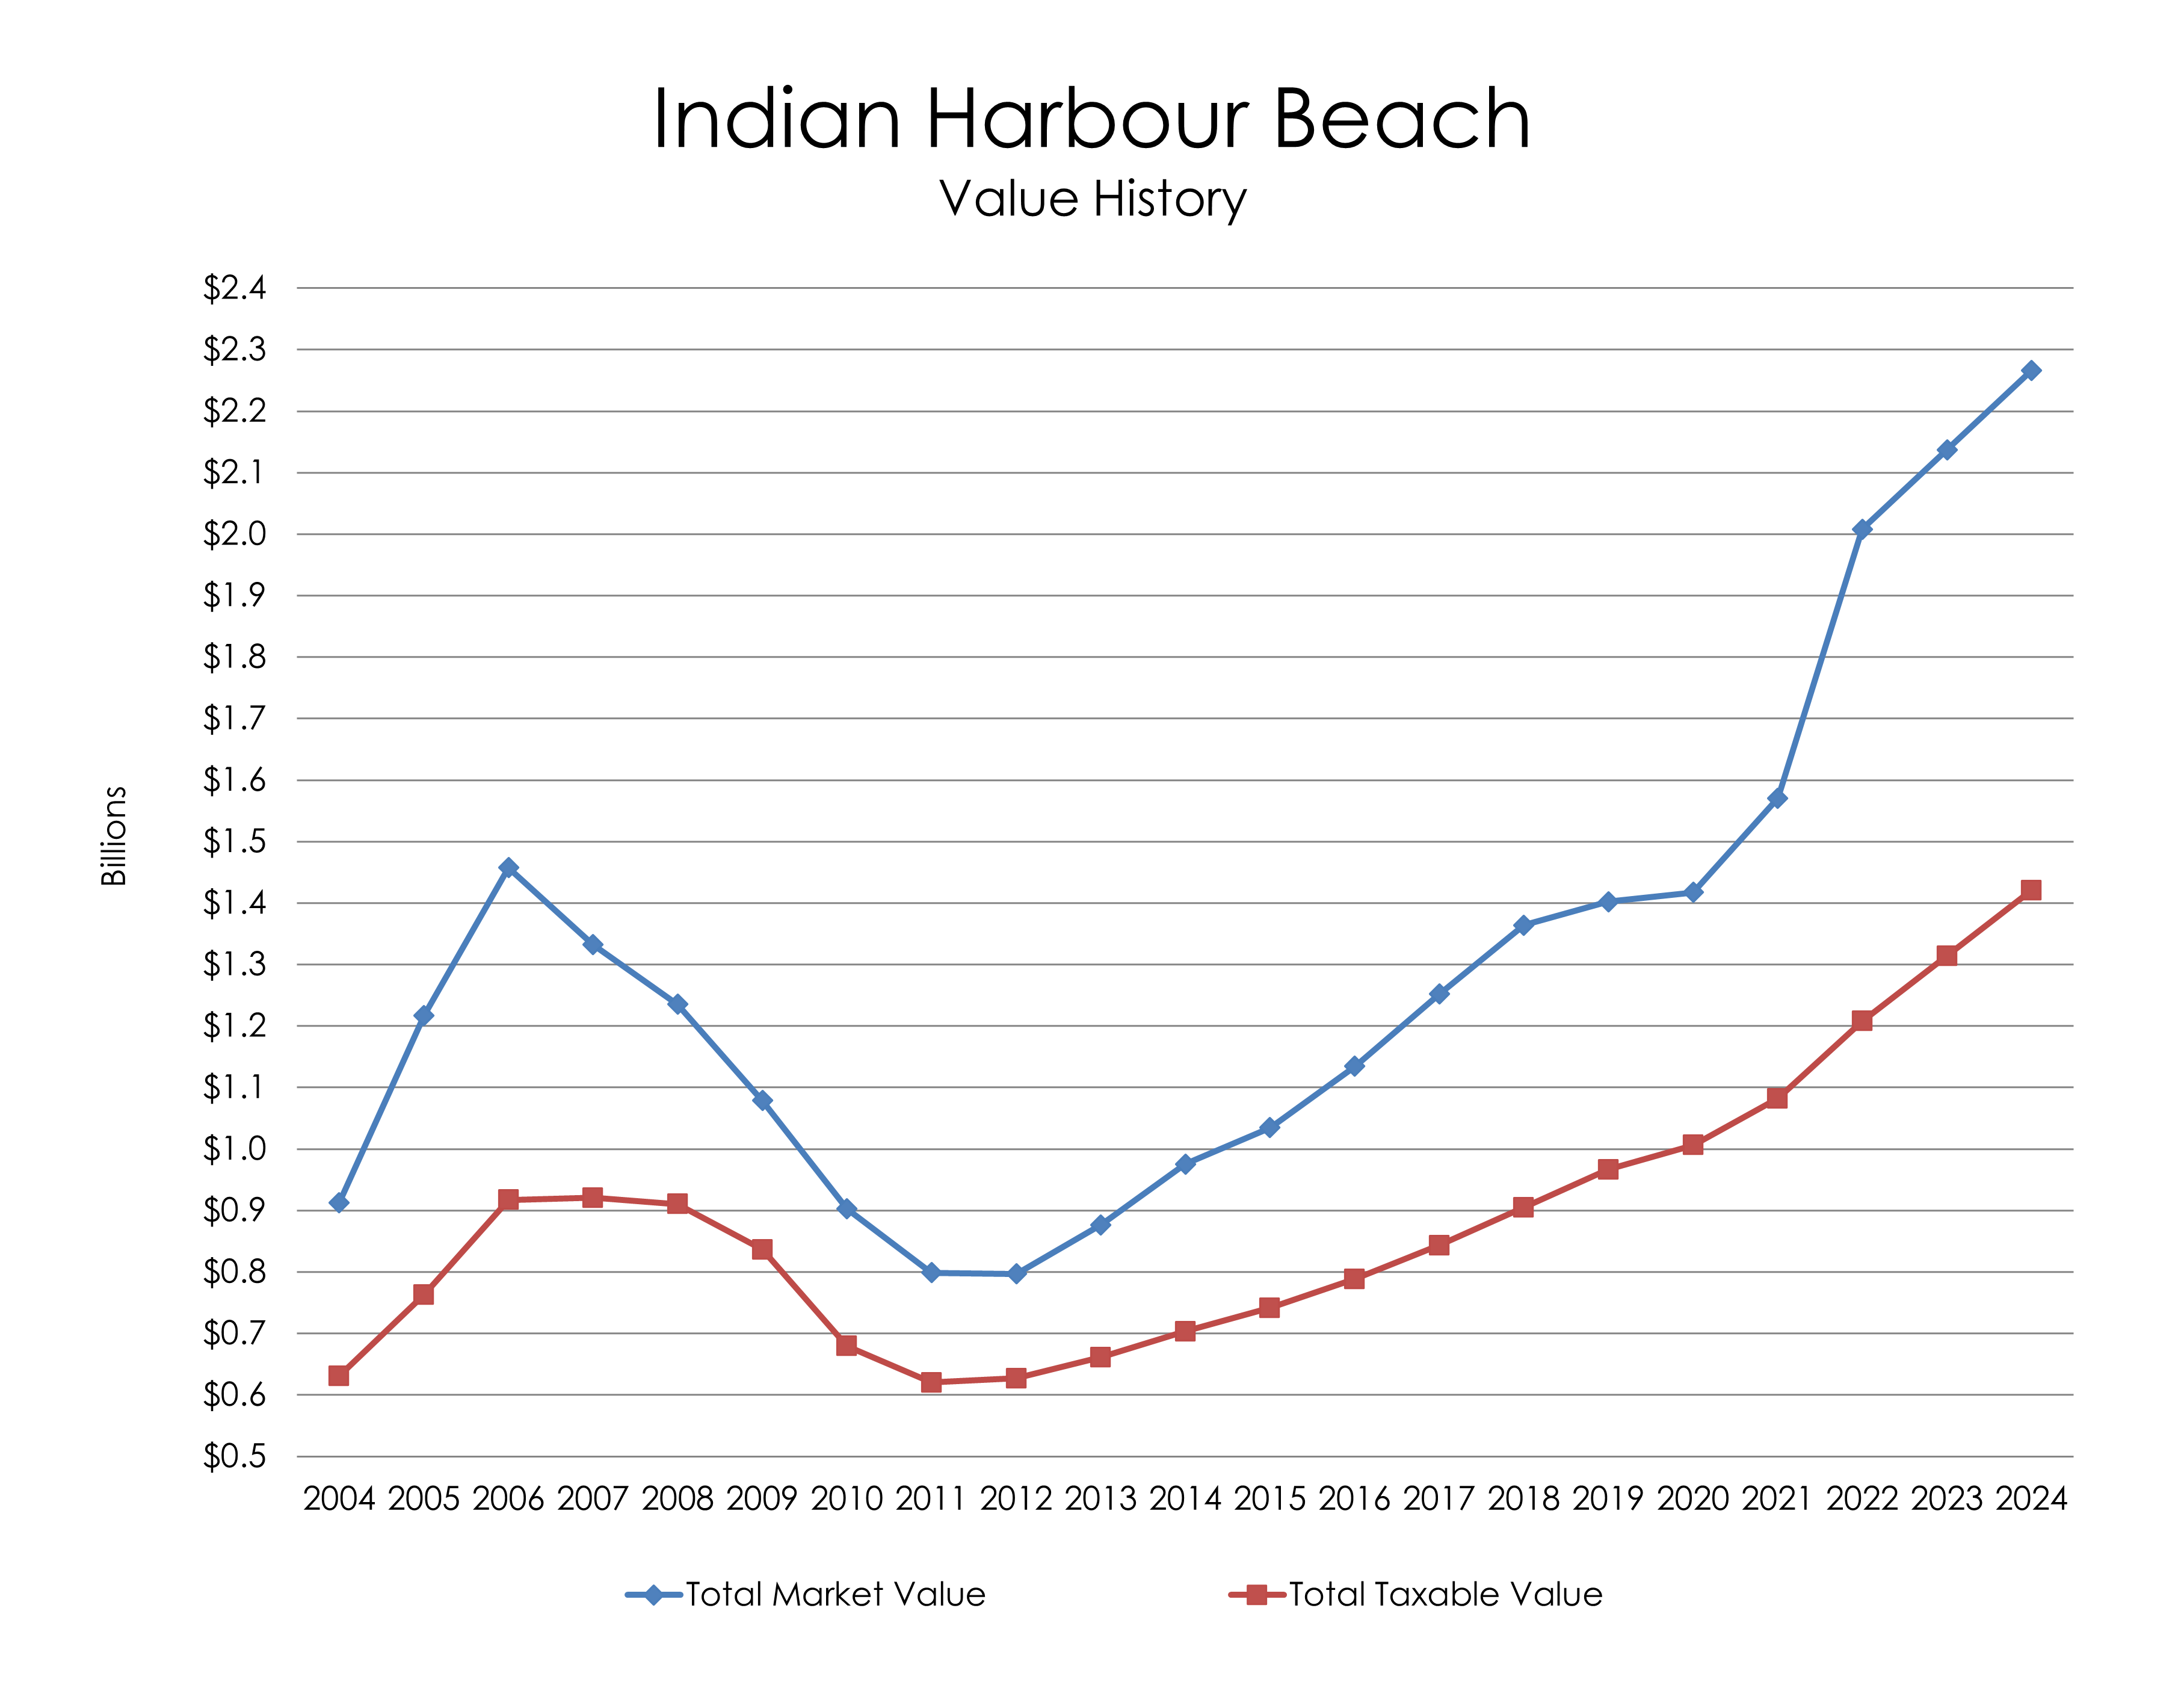 This chart shows how the Town of Indan Harbour Beach's Total Market Value rose rapidly from 2004 to 2006, but quickly dropped soon after until recovering after 2012. Total Taxable Value also reached a high point during this time, and declined rapidly as market values plunged.
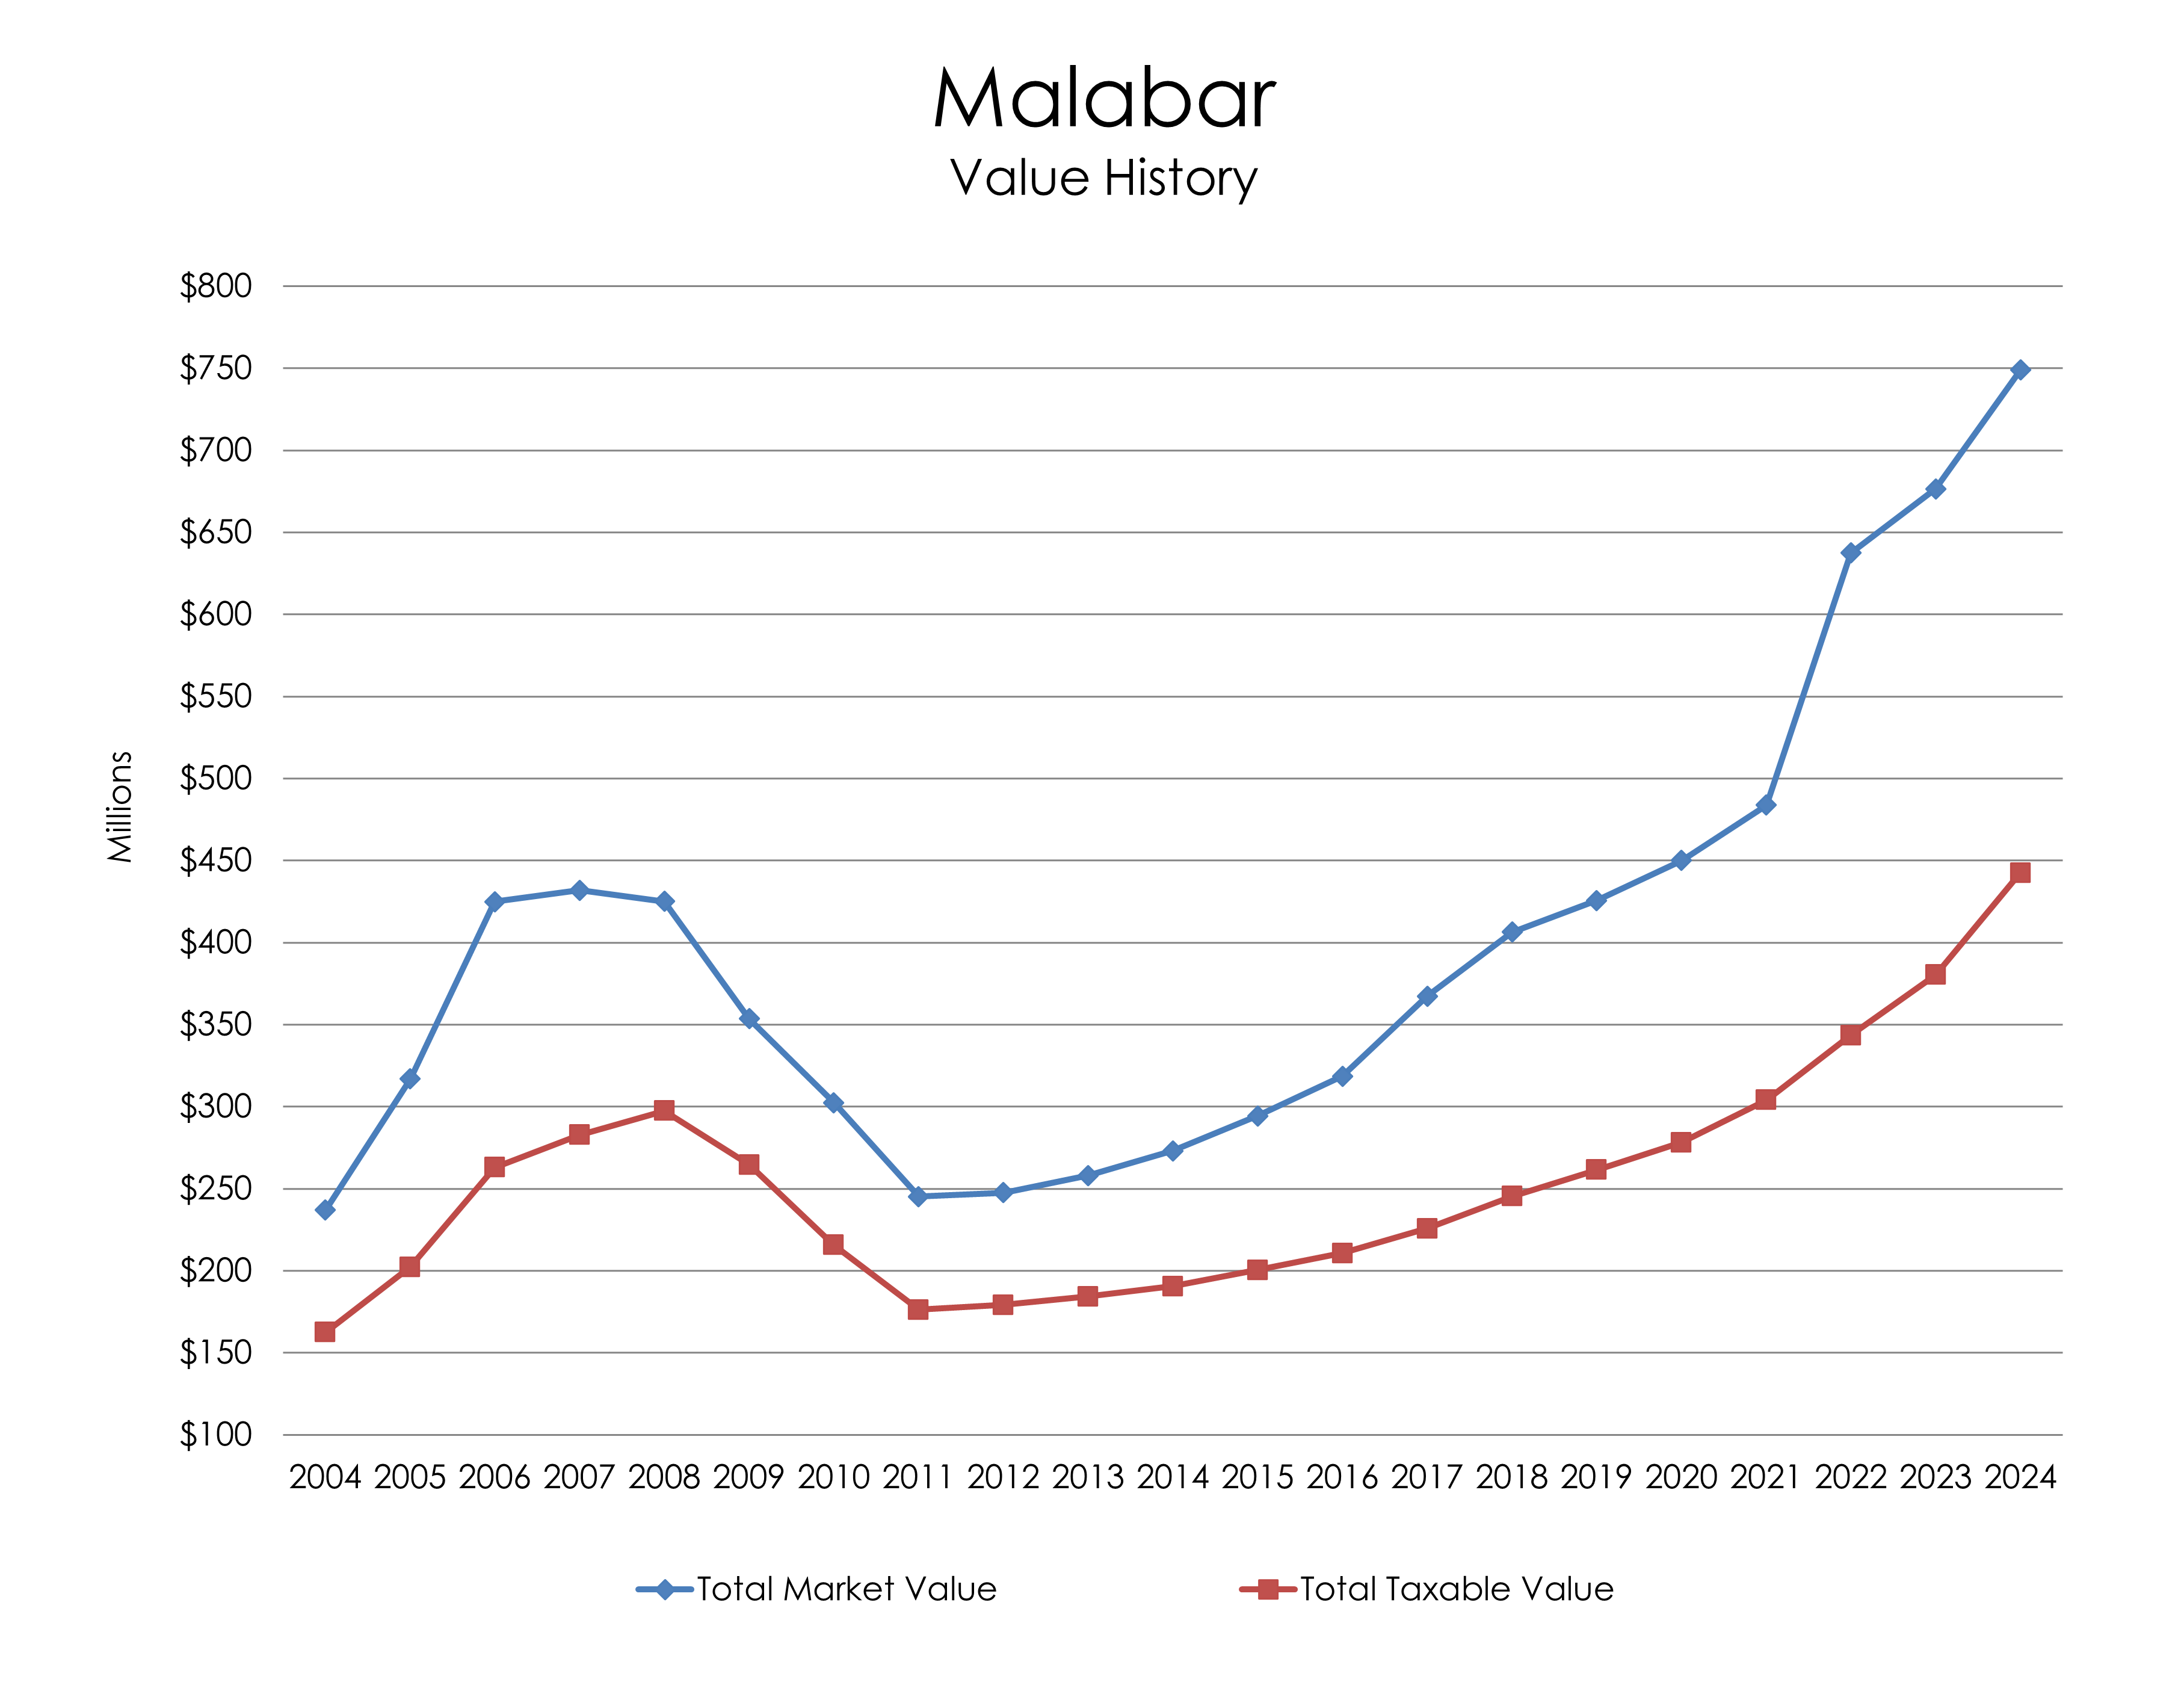 This chart shows how the Town of Malabar's Total Market Value followed the 2005-2008 real estate boom and subsequent bubble burst. Total Taxable Value also reached a high point during this time, and declined rapidly as market values plunged.
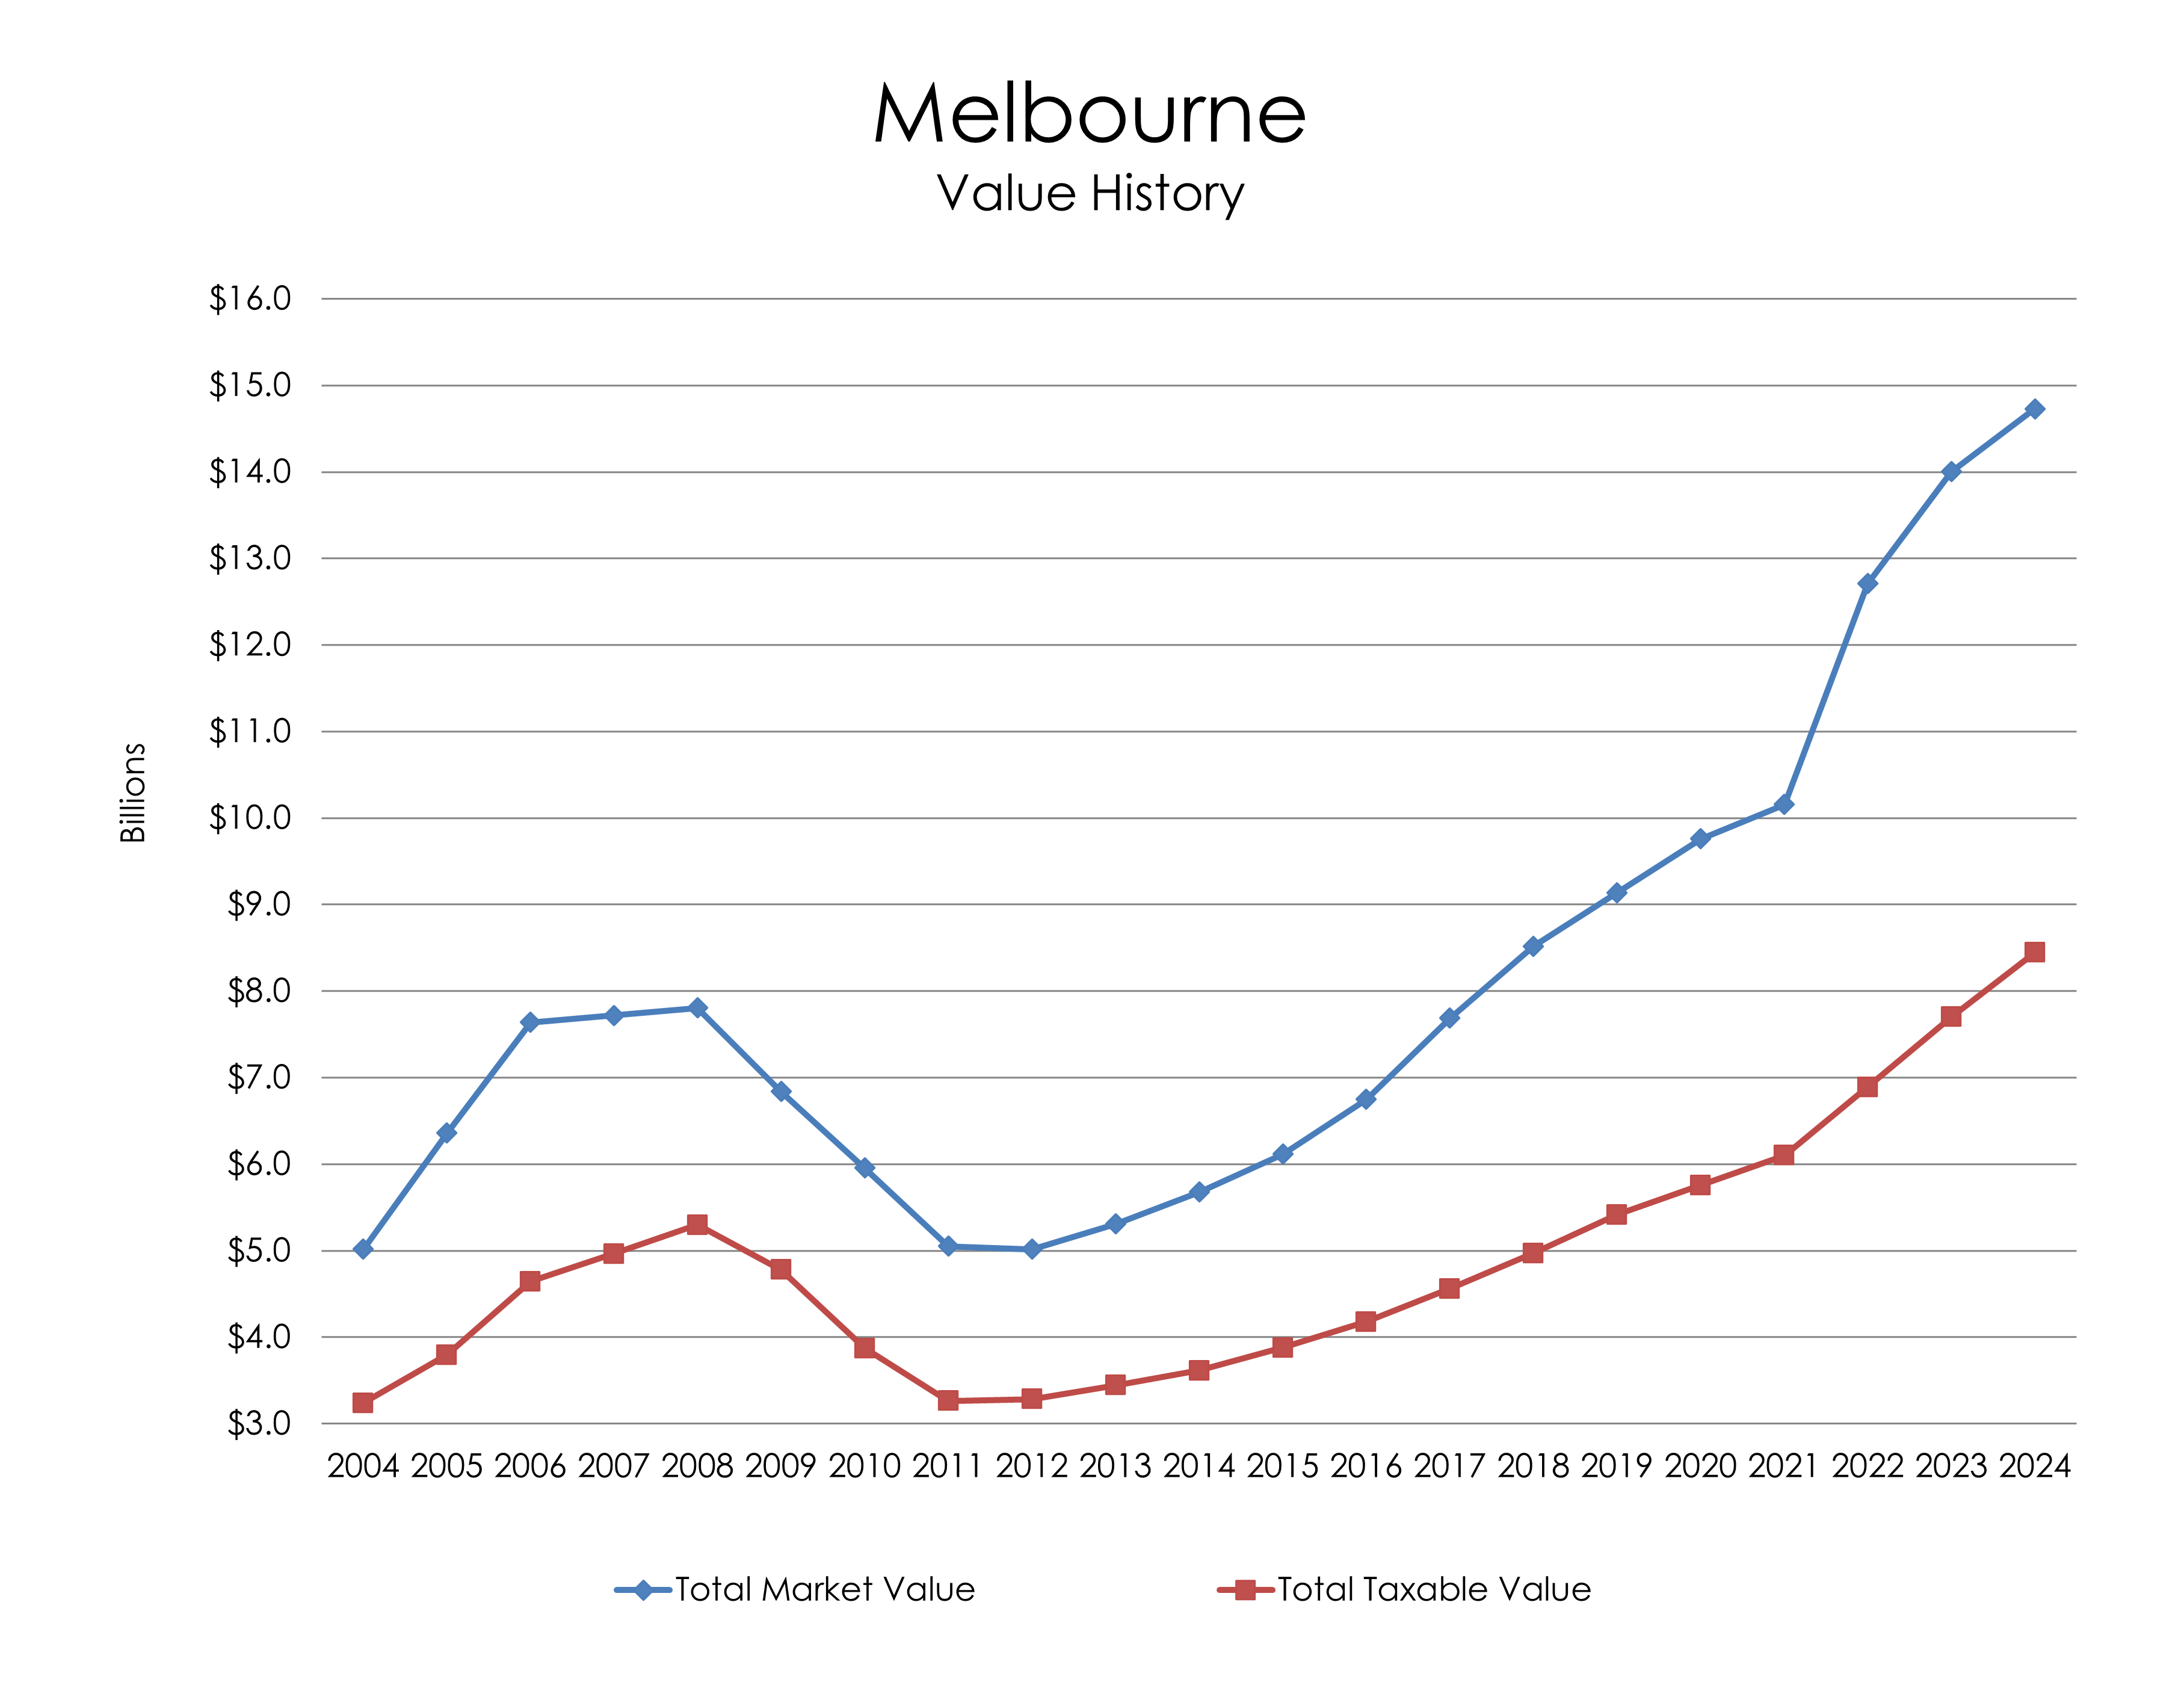 This chart shows how the City of Melbourne's Total Market Value followed the 2005-2008 real estate boom and subsequent bubble burst. Total Taxable Value also reached a high point during this time, and declined rapidly as market values plunged.
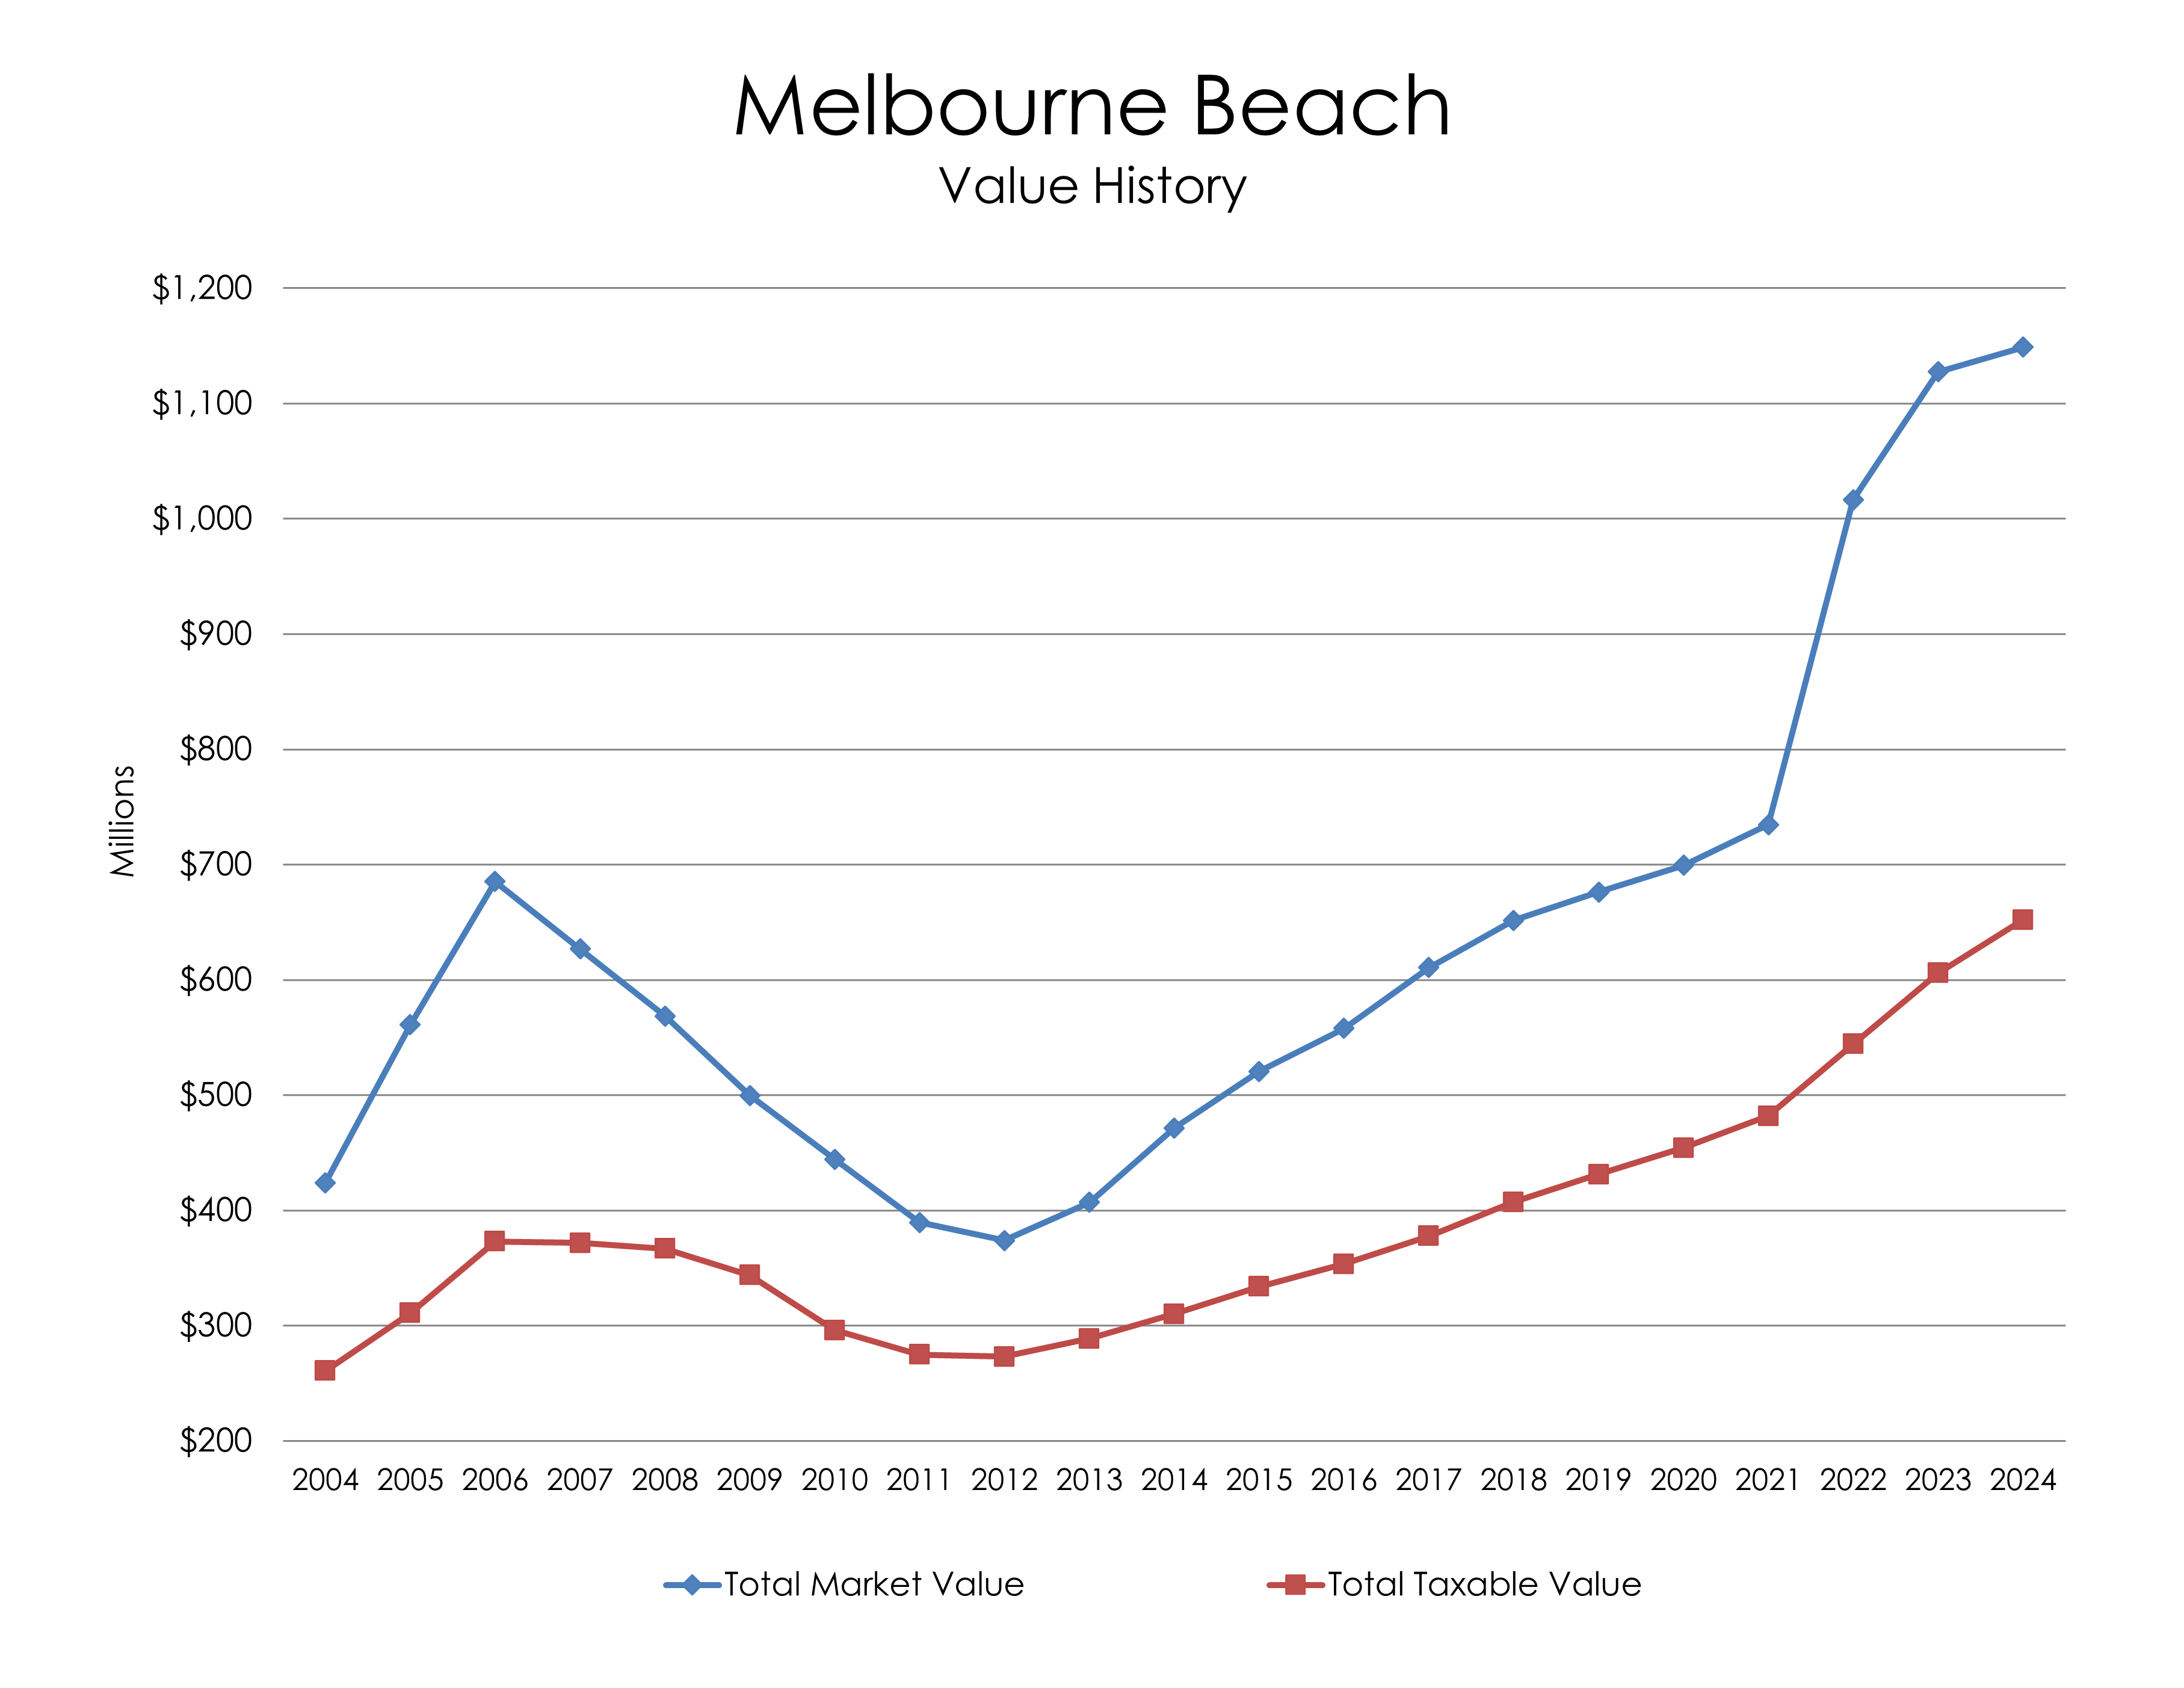 This chart shows how the Town of Melbourne Beach's Total Market Value rose rapidly from 2004 to 2006, but quickly dropped soon after until recovering after 2012. Total Taxable Value also reached a high point during this time, and declined rapidly as market values plunged.
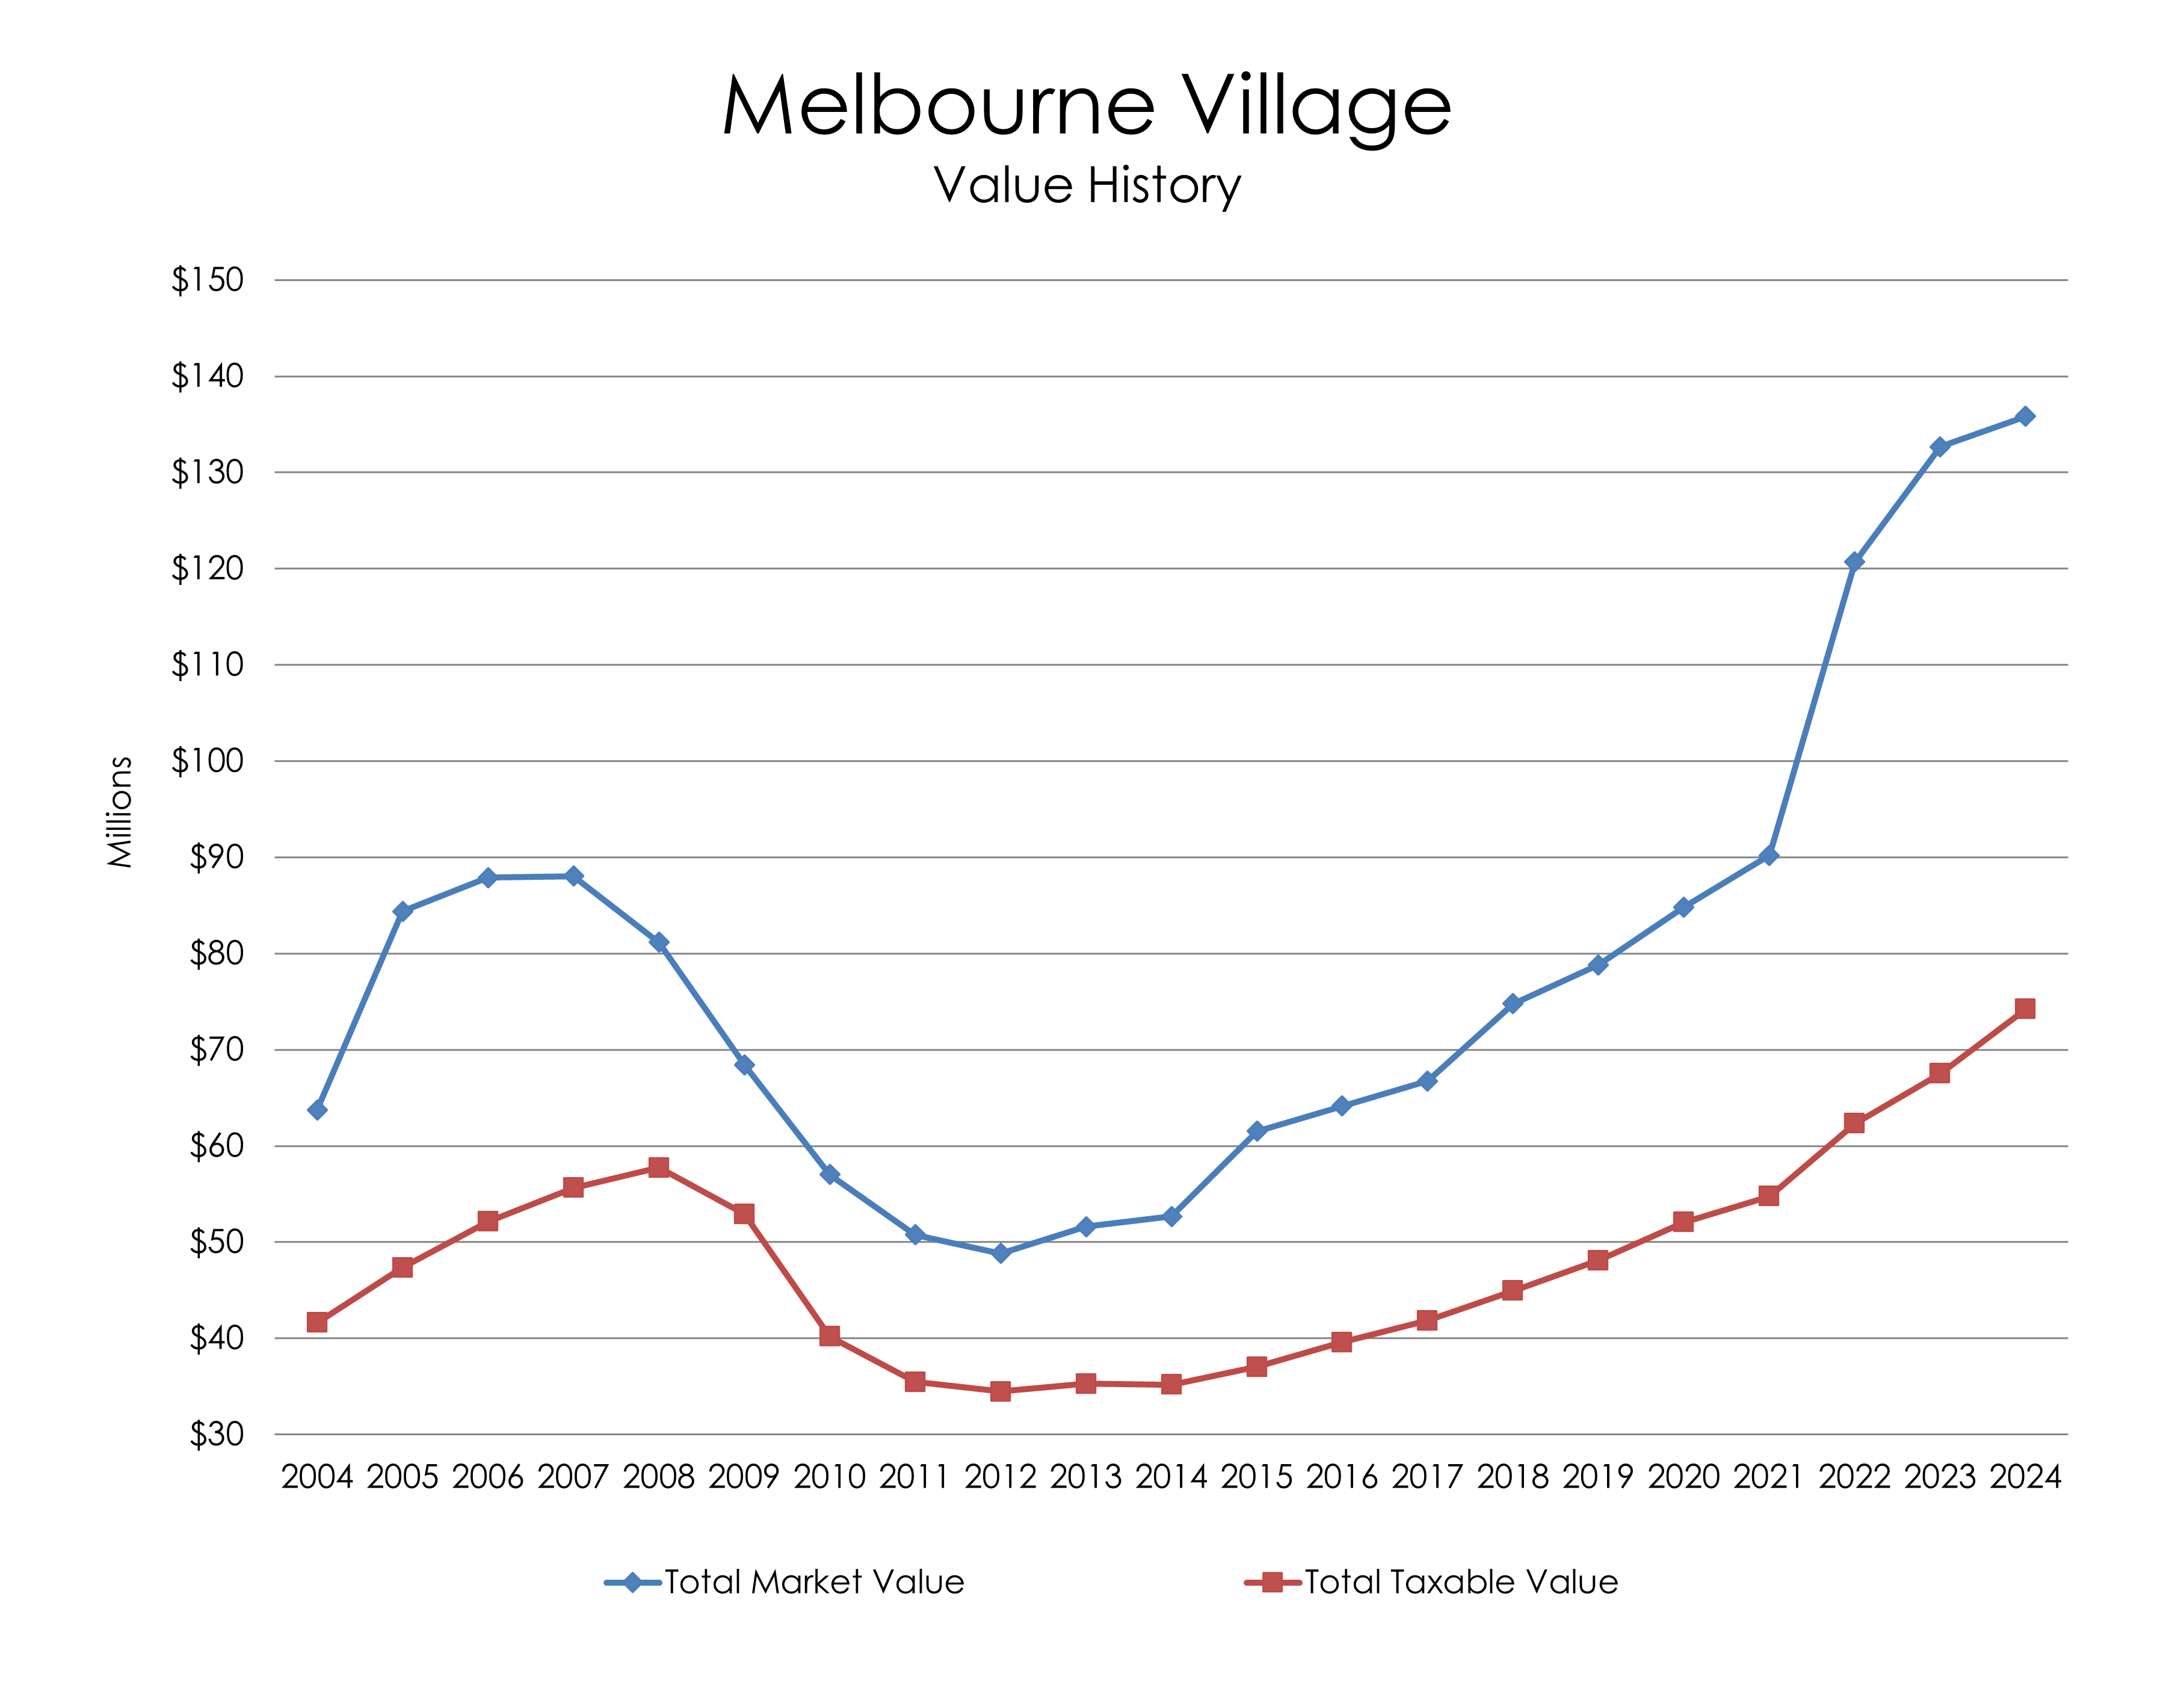 This chart shows how the Town of Melbourne Village's Total Market Value followed the real estate boom through 2007, but declined rapidly as the real estate market bubble burst. Total Taxable Value also reached a high point during this time, and declined rapidly as market values plunged.
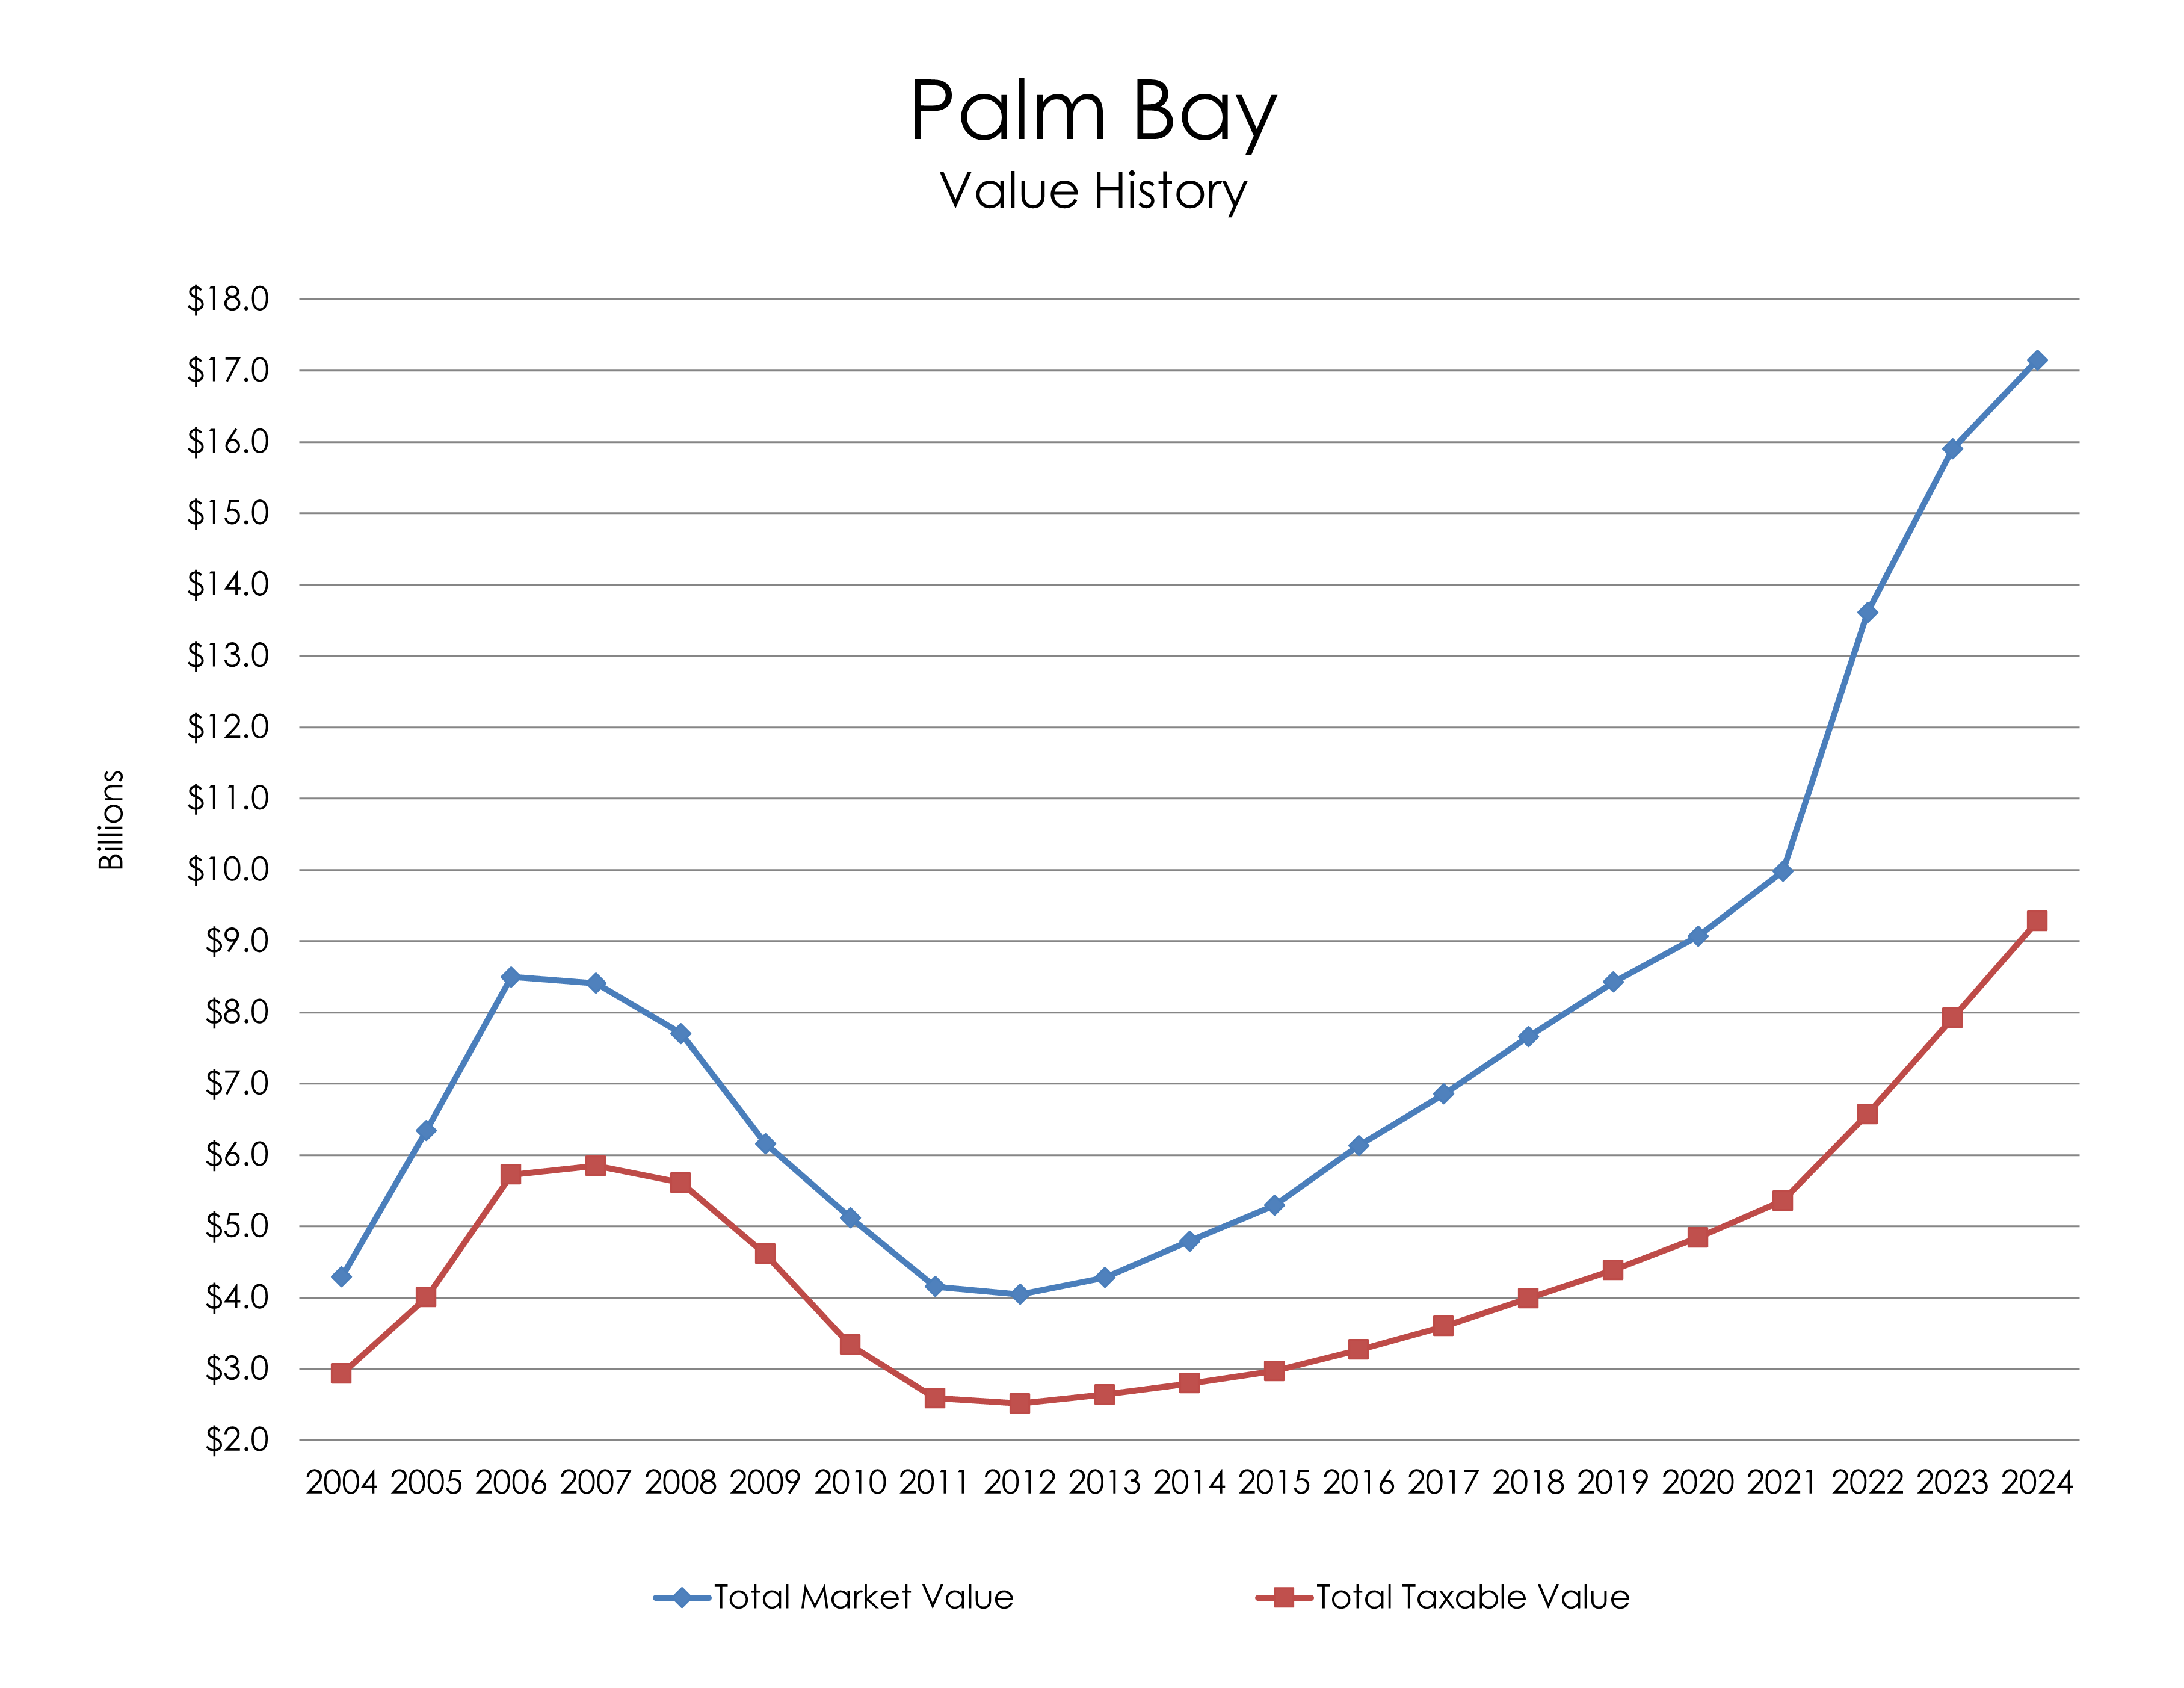 This chart shows how the City of Palm Bay's Total Market Value rose rapidly from 2004 to 2006, dropping slightly in 2007, until plummeting through the real estate market bubble burst until recovering after 2012. Total Taxable Value also reached a high point during this time, and declined rapidly as market values plunged.
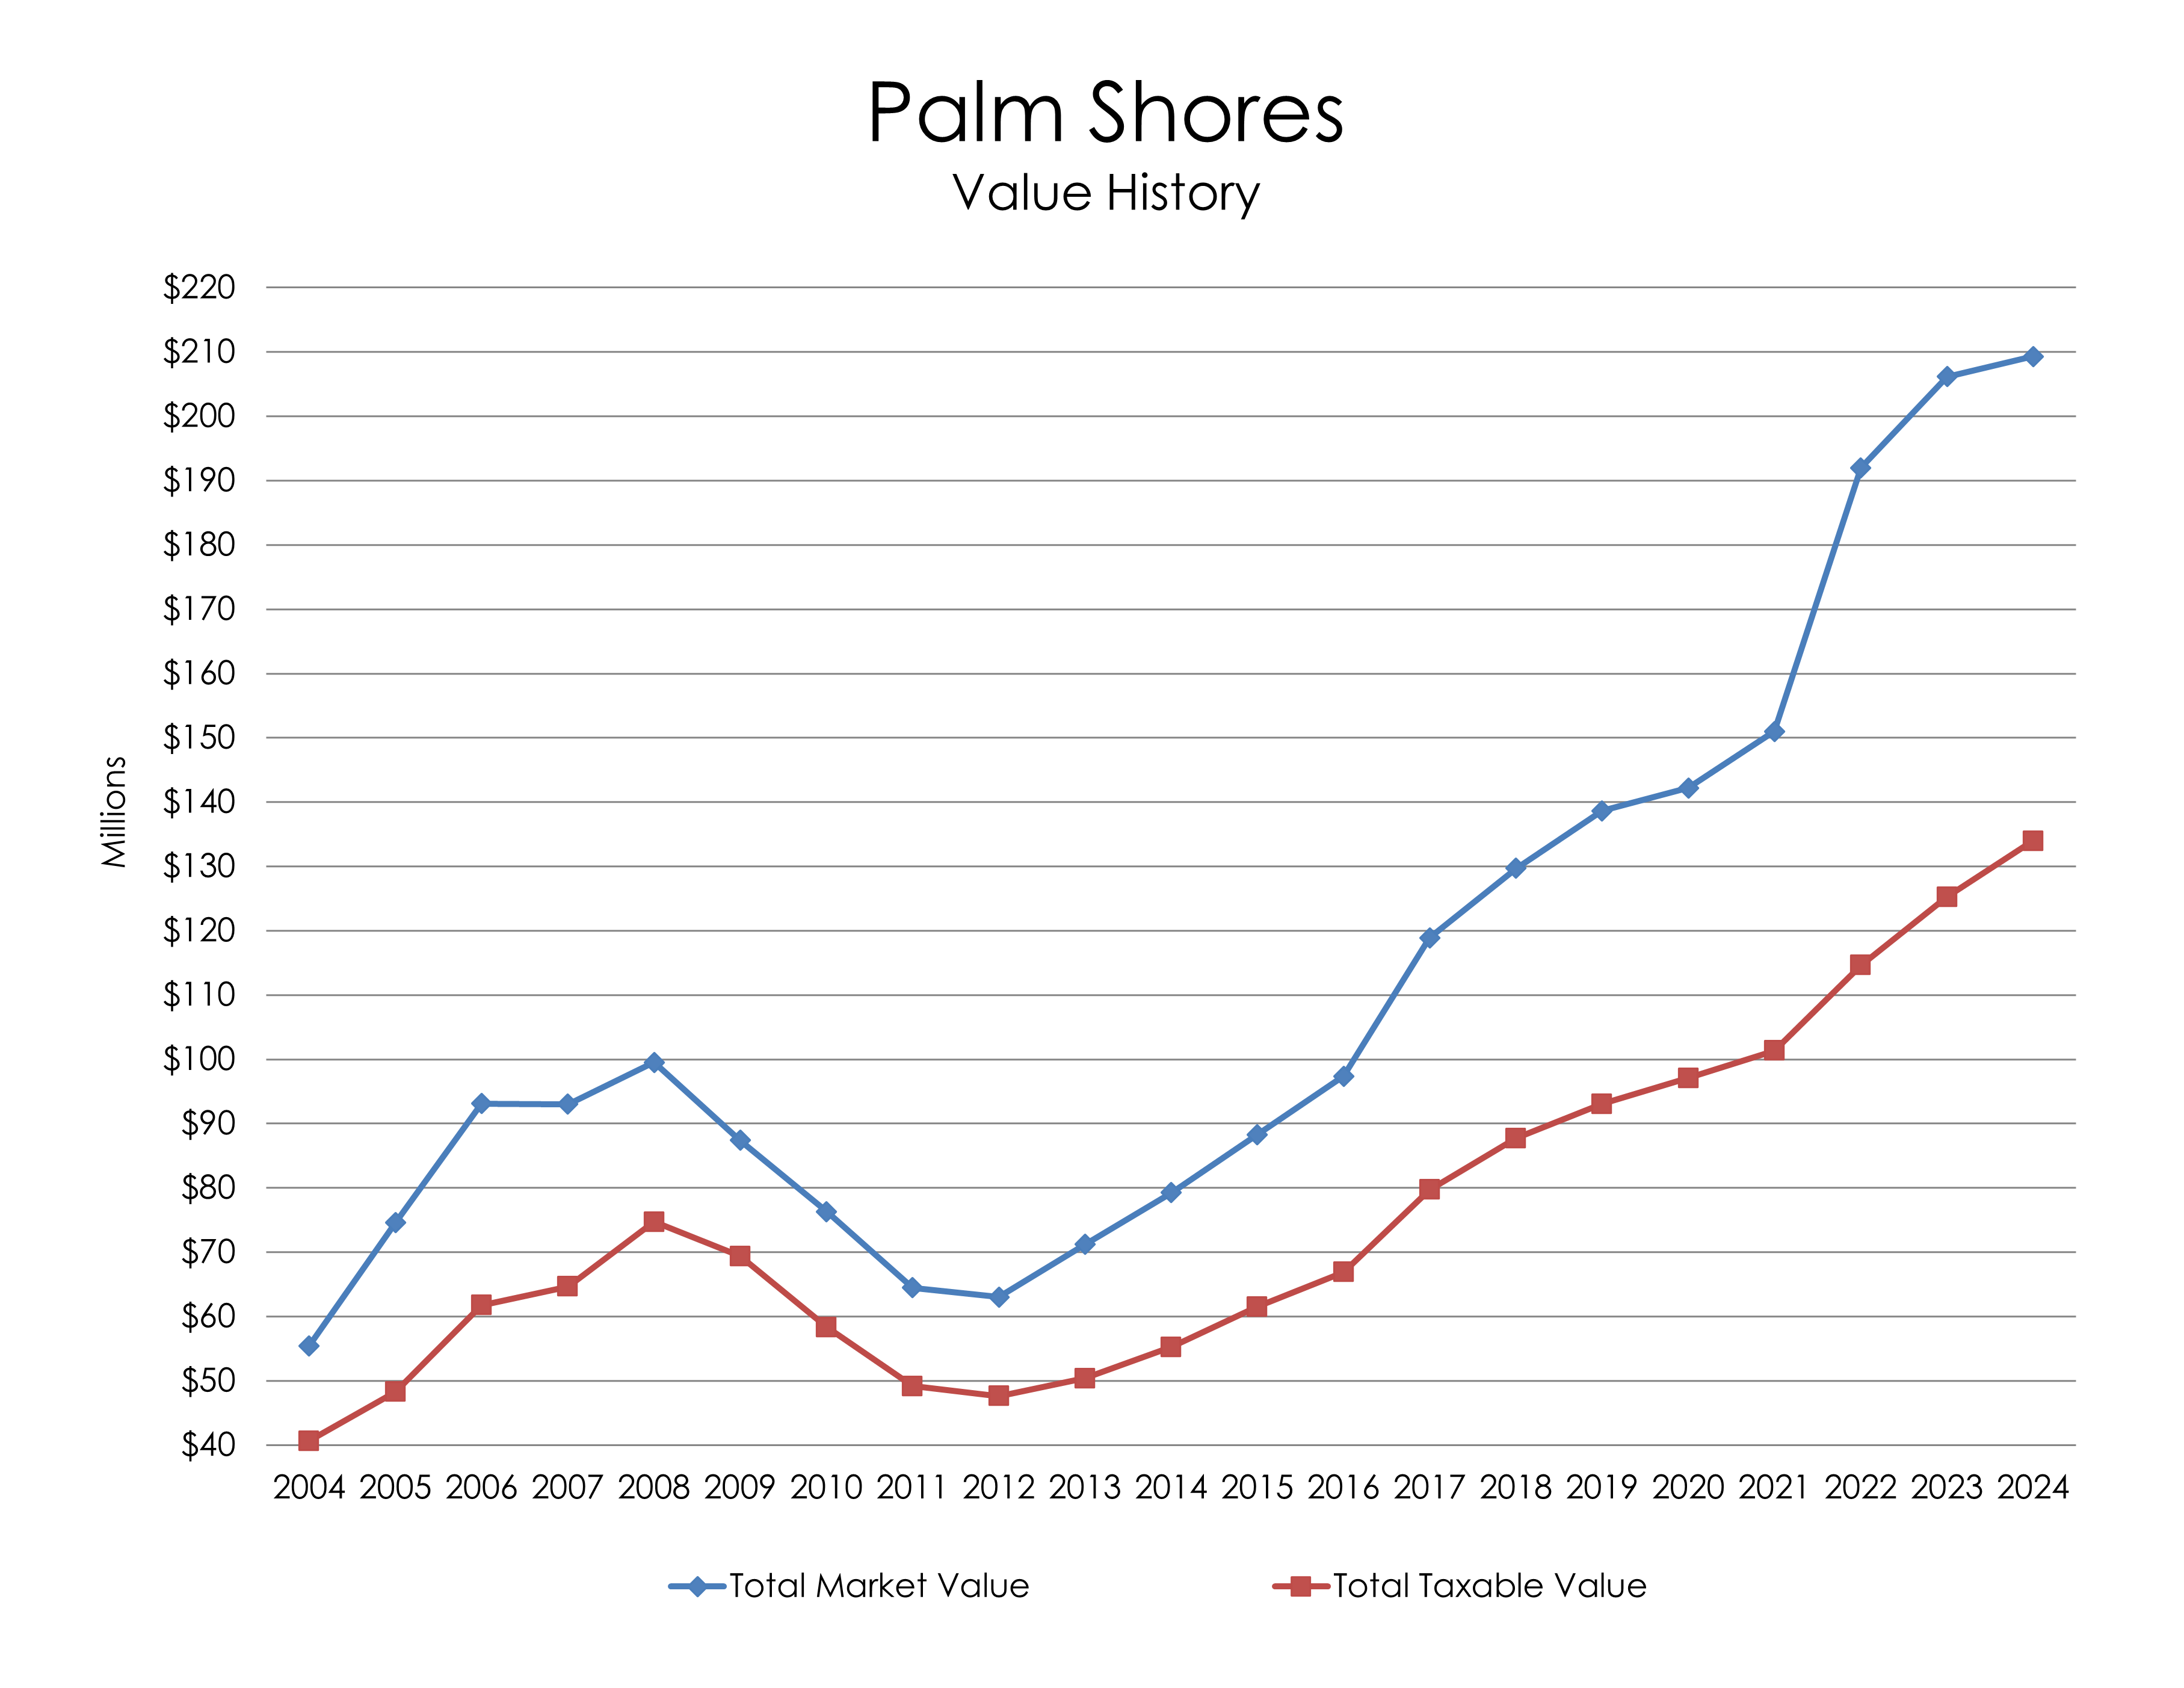 This chart shows how the Town of Palm Shores' Total Market Value followed the 2005-2008 real estate boom and subsequent bubble burst. Total Taxable Value also reached a high point during this time, and declined rapidly as market values plunged.
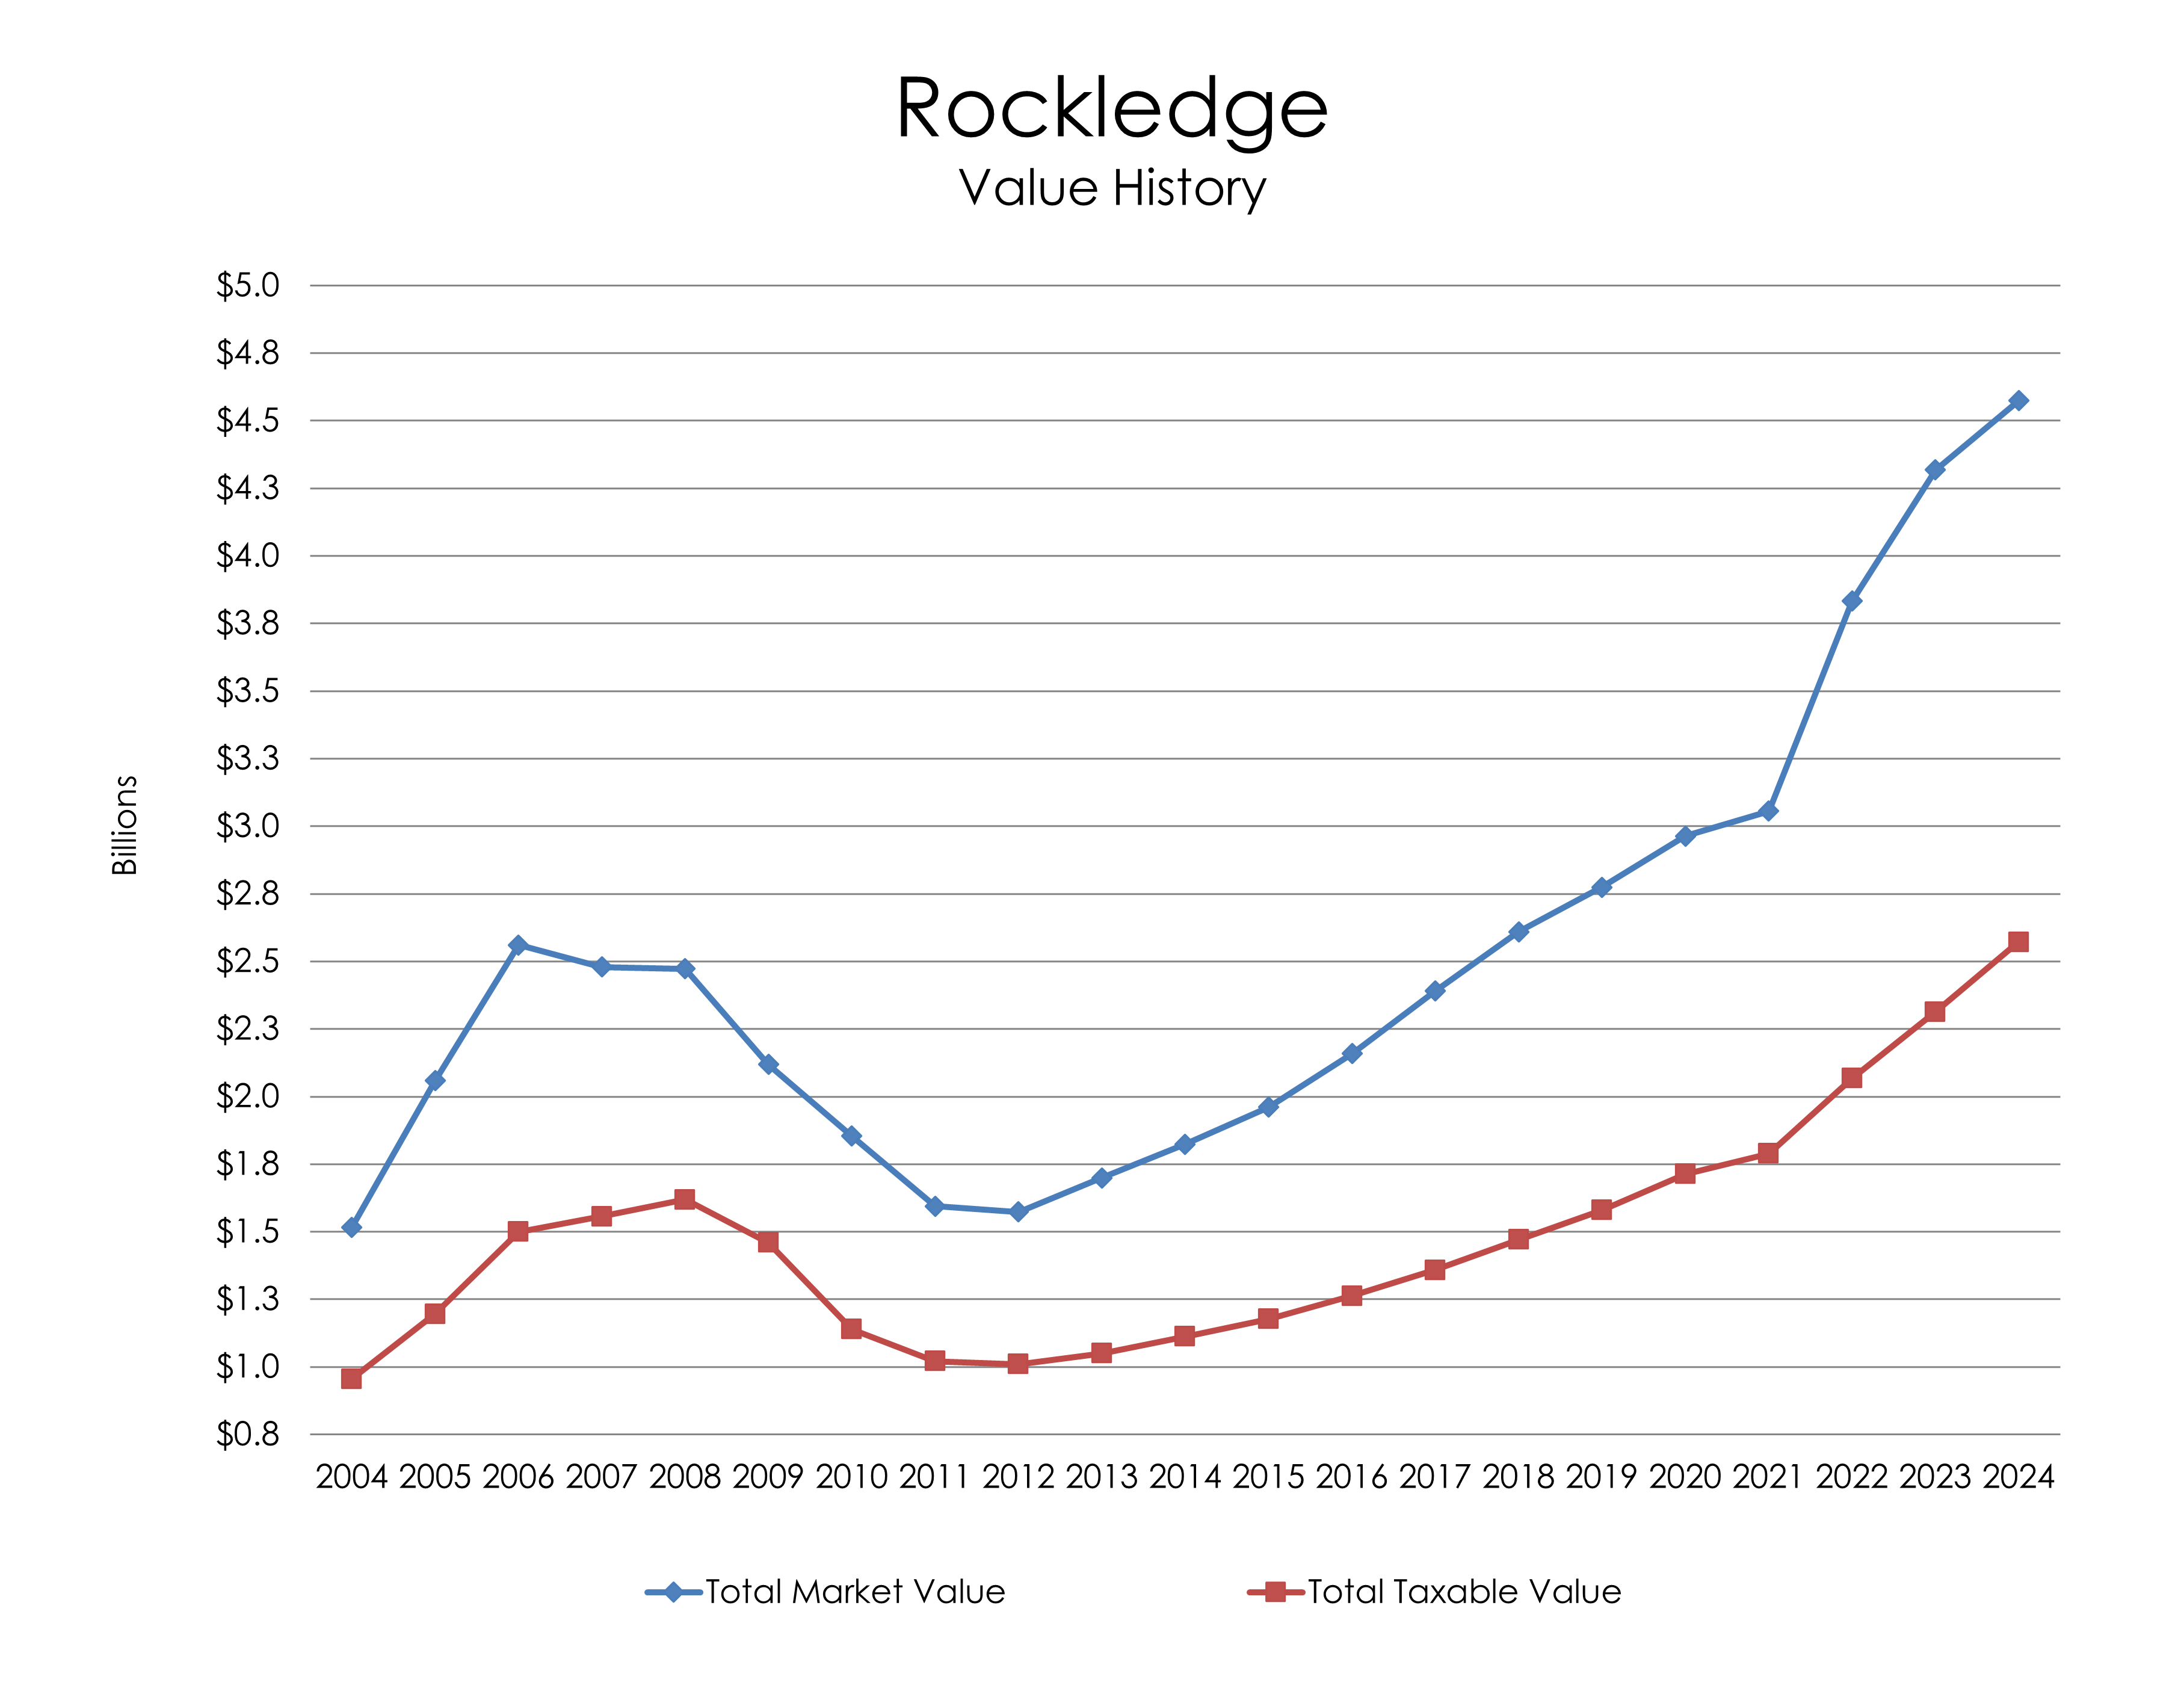 This chart shows how the City of Rockledge's Total Market Value followed the 2005-2008 real estate boom and subsequent bubble burst. Total Taxable Value also reached a high point during this time, and declined rapidly as market values plunged.
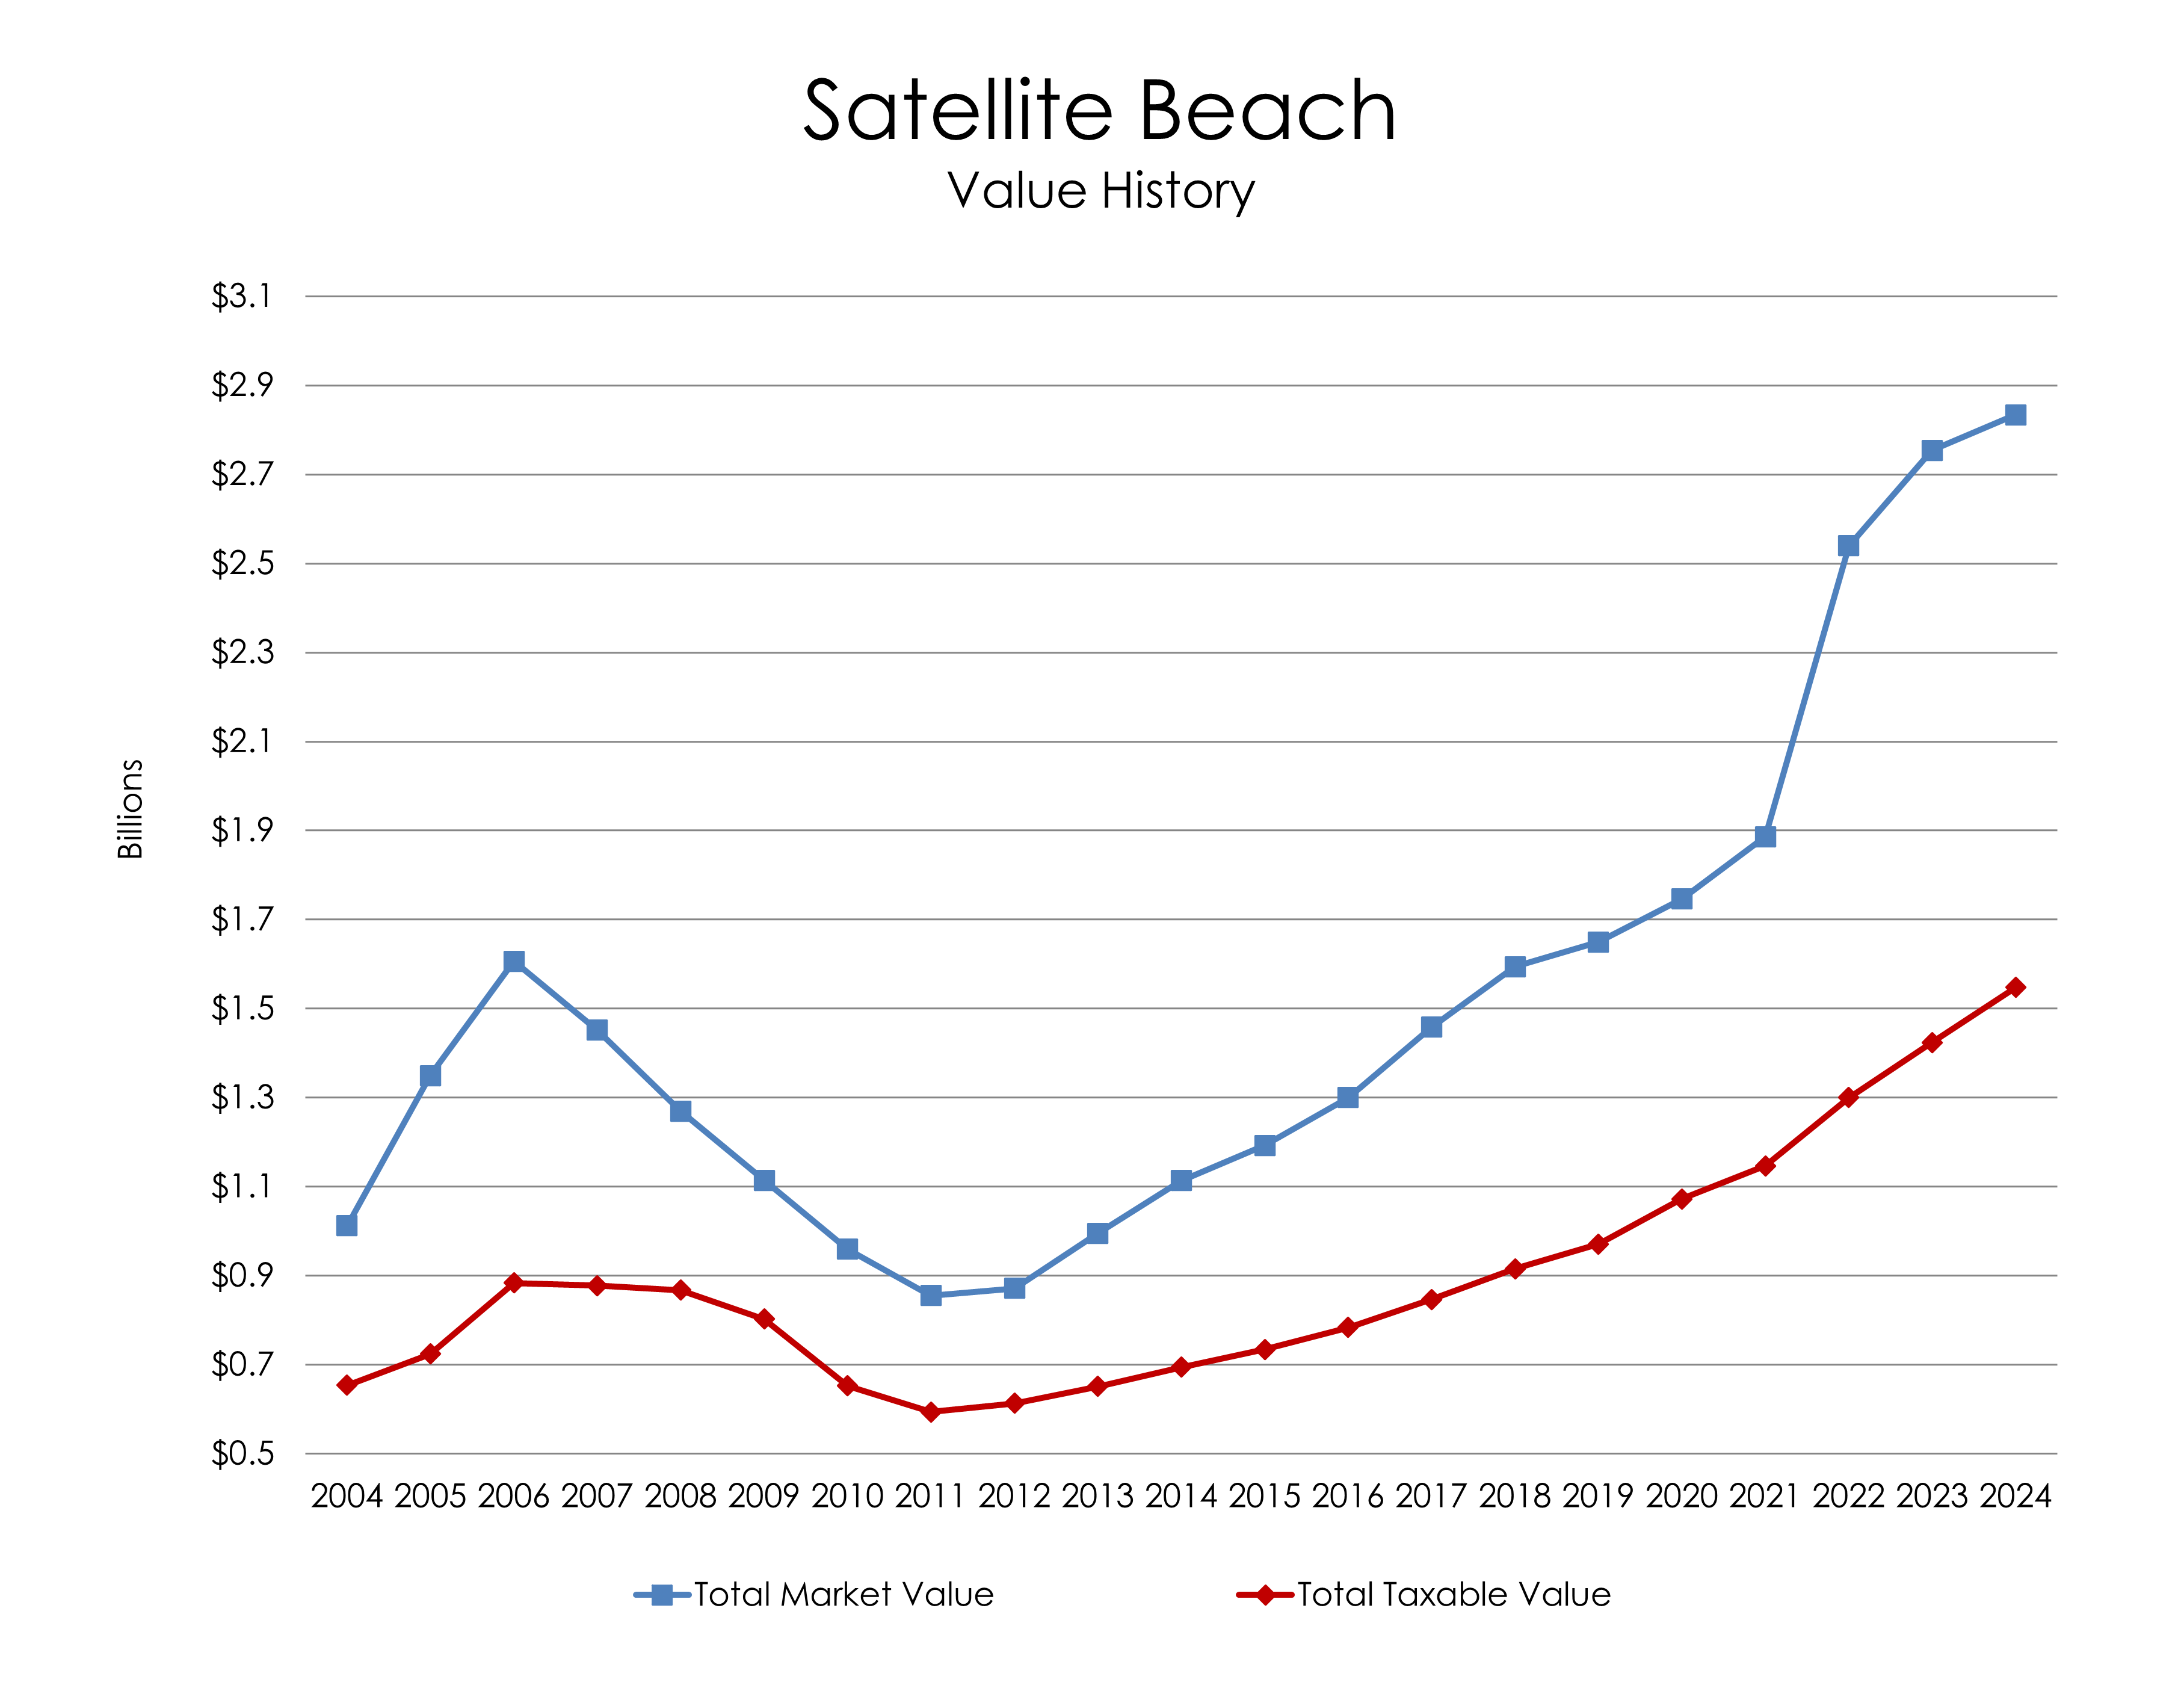 This chart shows how the City of Satellite Beach's Total Market Value rose rapidly from 2004 to 2006, but quickly dropped soon after until recovering after 2011. Total Taxable Value also reached a high point during this time, and declined rapidly as market values plunged.
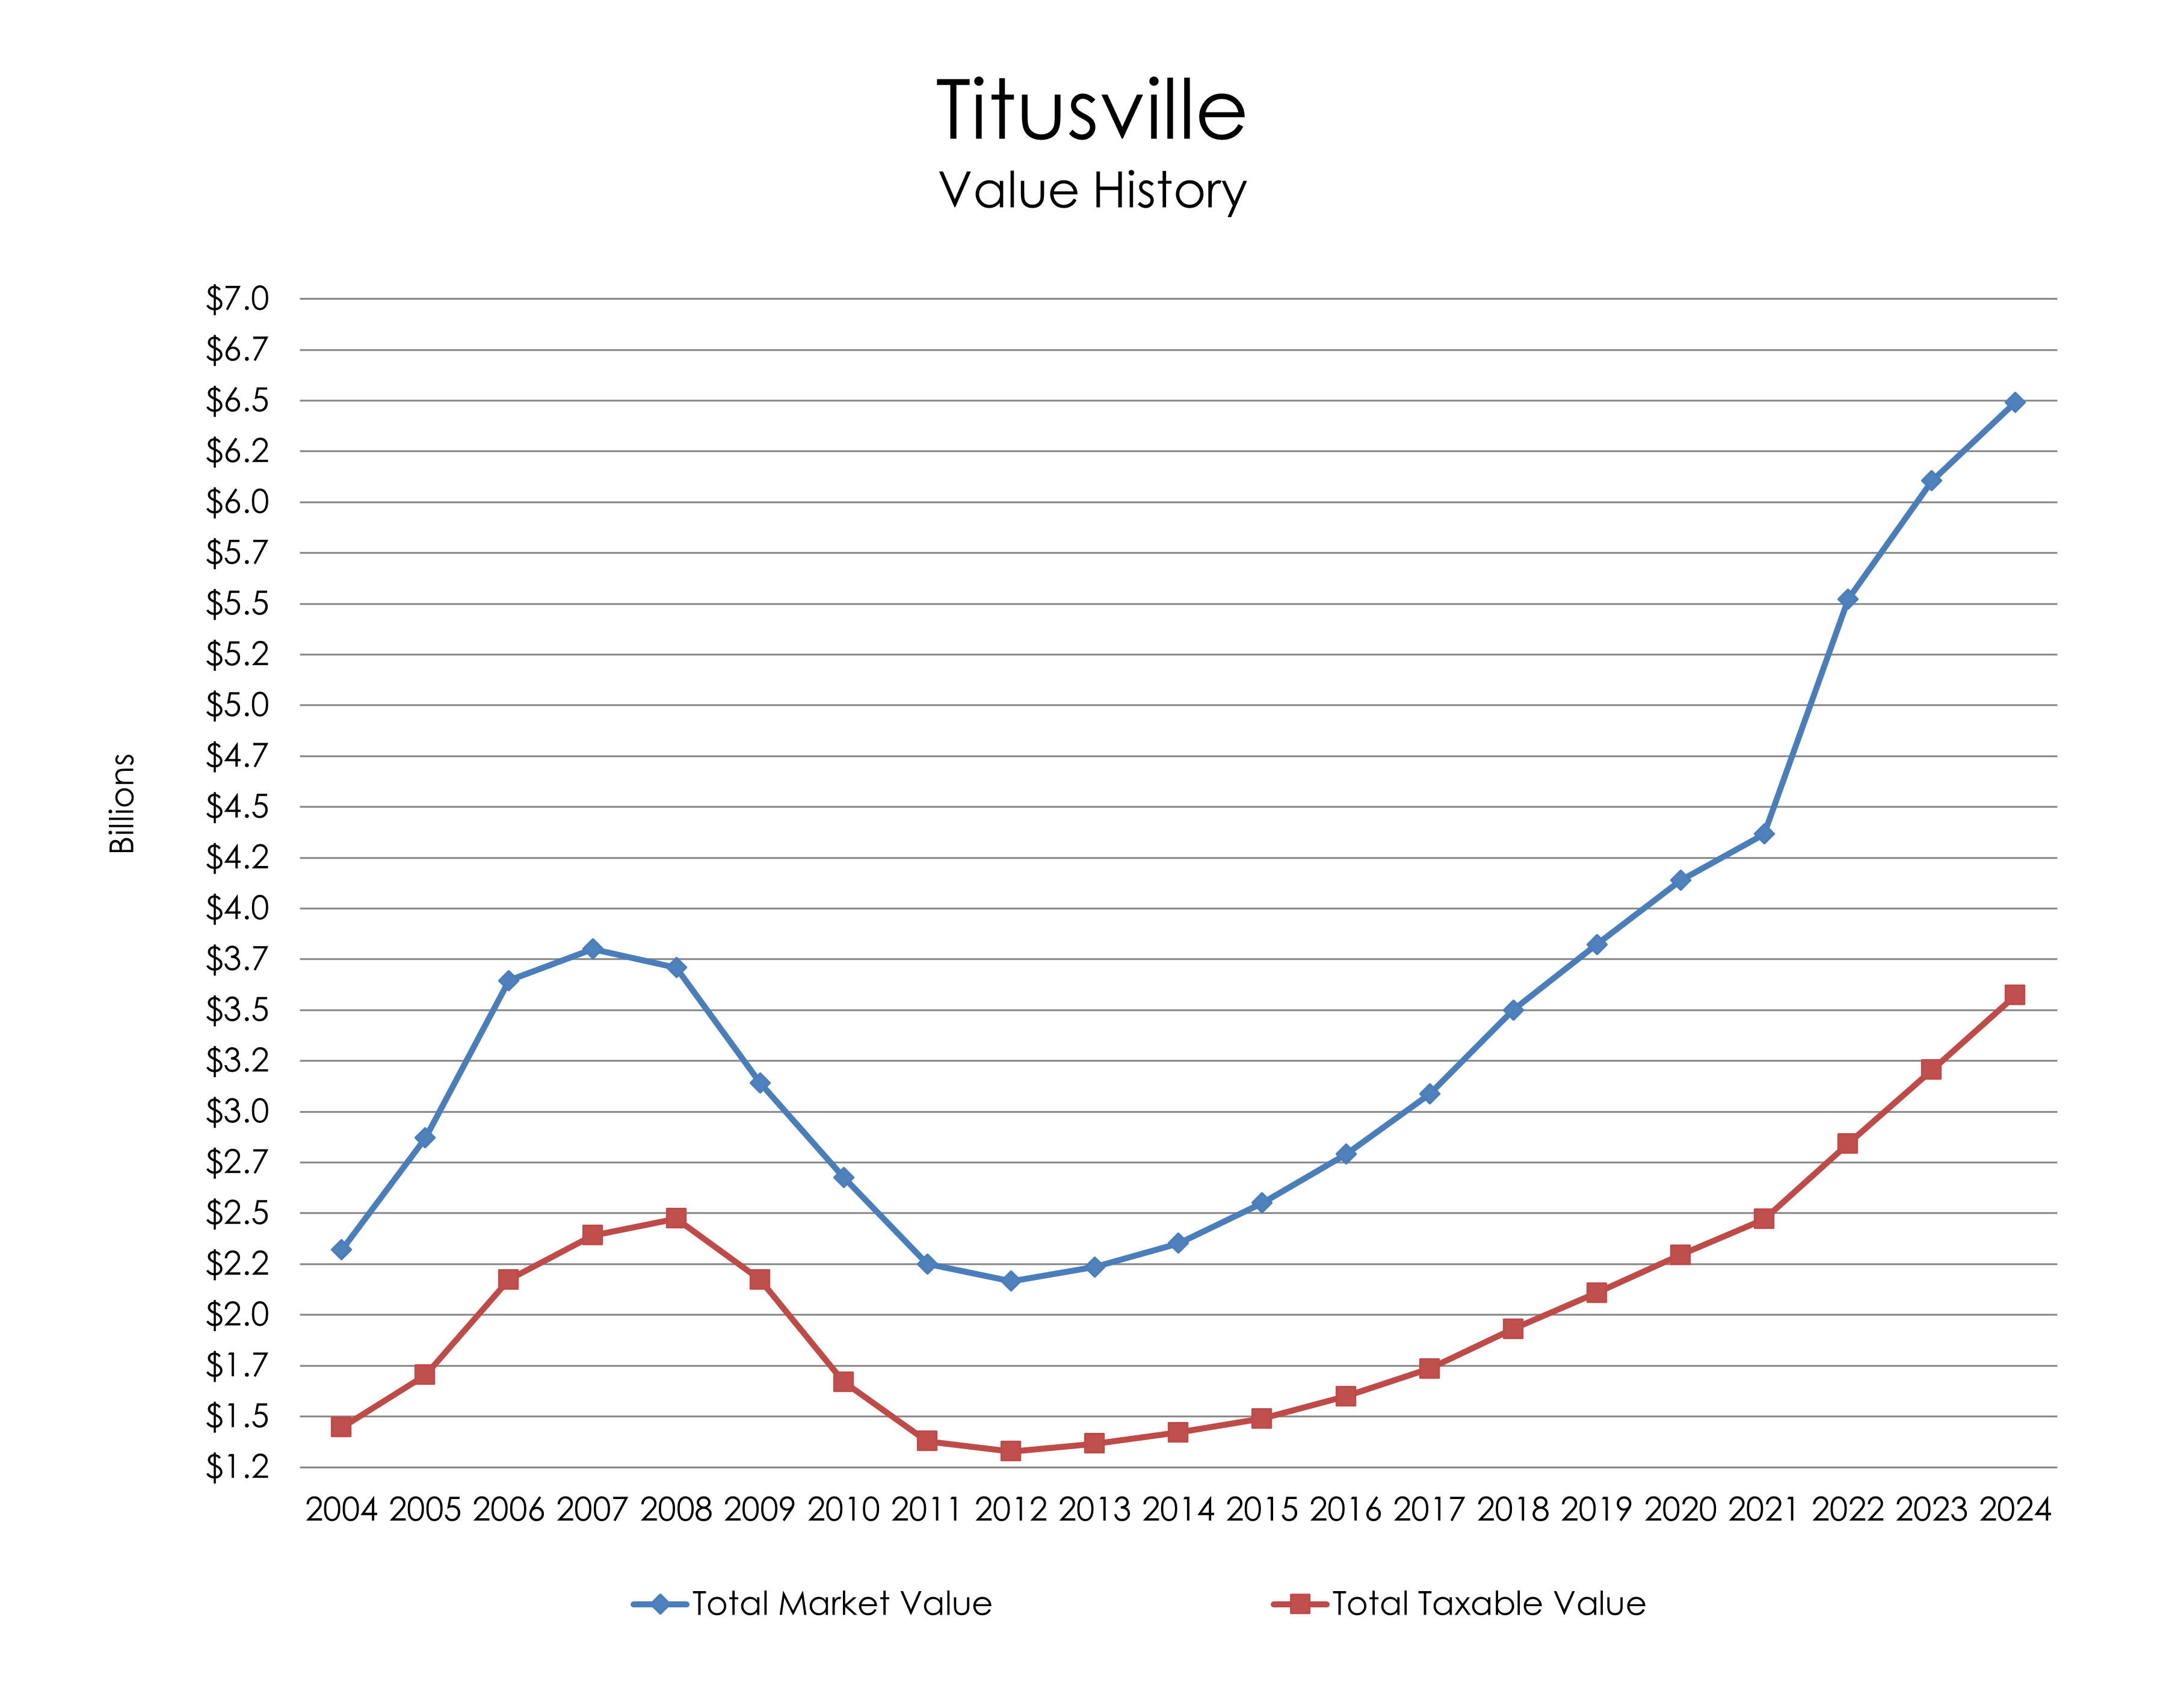 This chart shows how the City of Titusville's Total Market Value followed the 2005-2008 real estate boom and subsequent bubble burst. Total Taxable Value also reached a high point during this time, and declined rapidly as market values plunged.
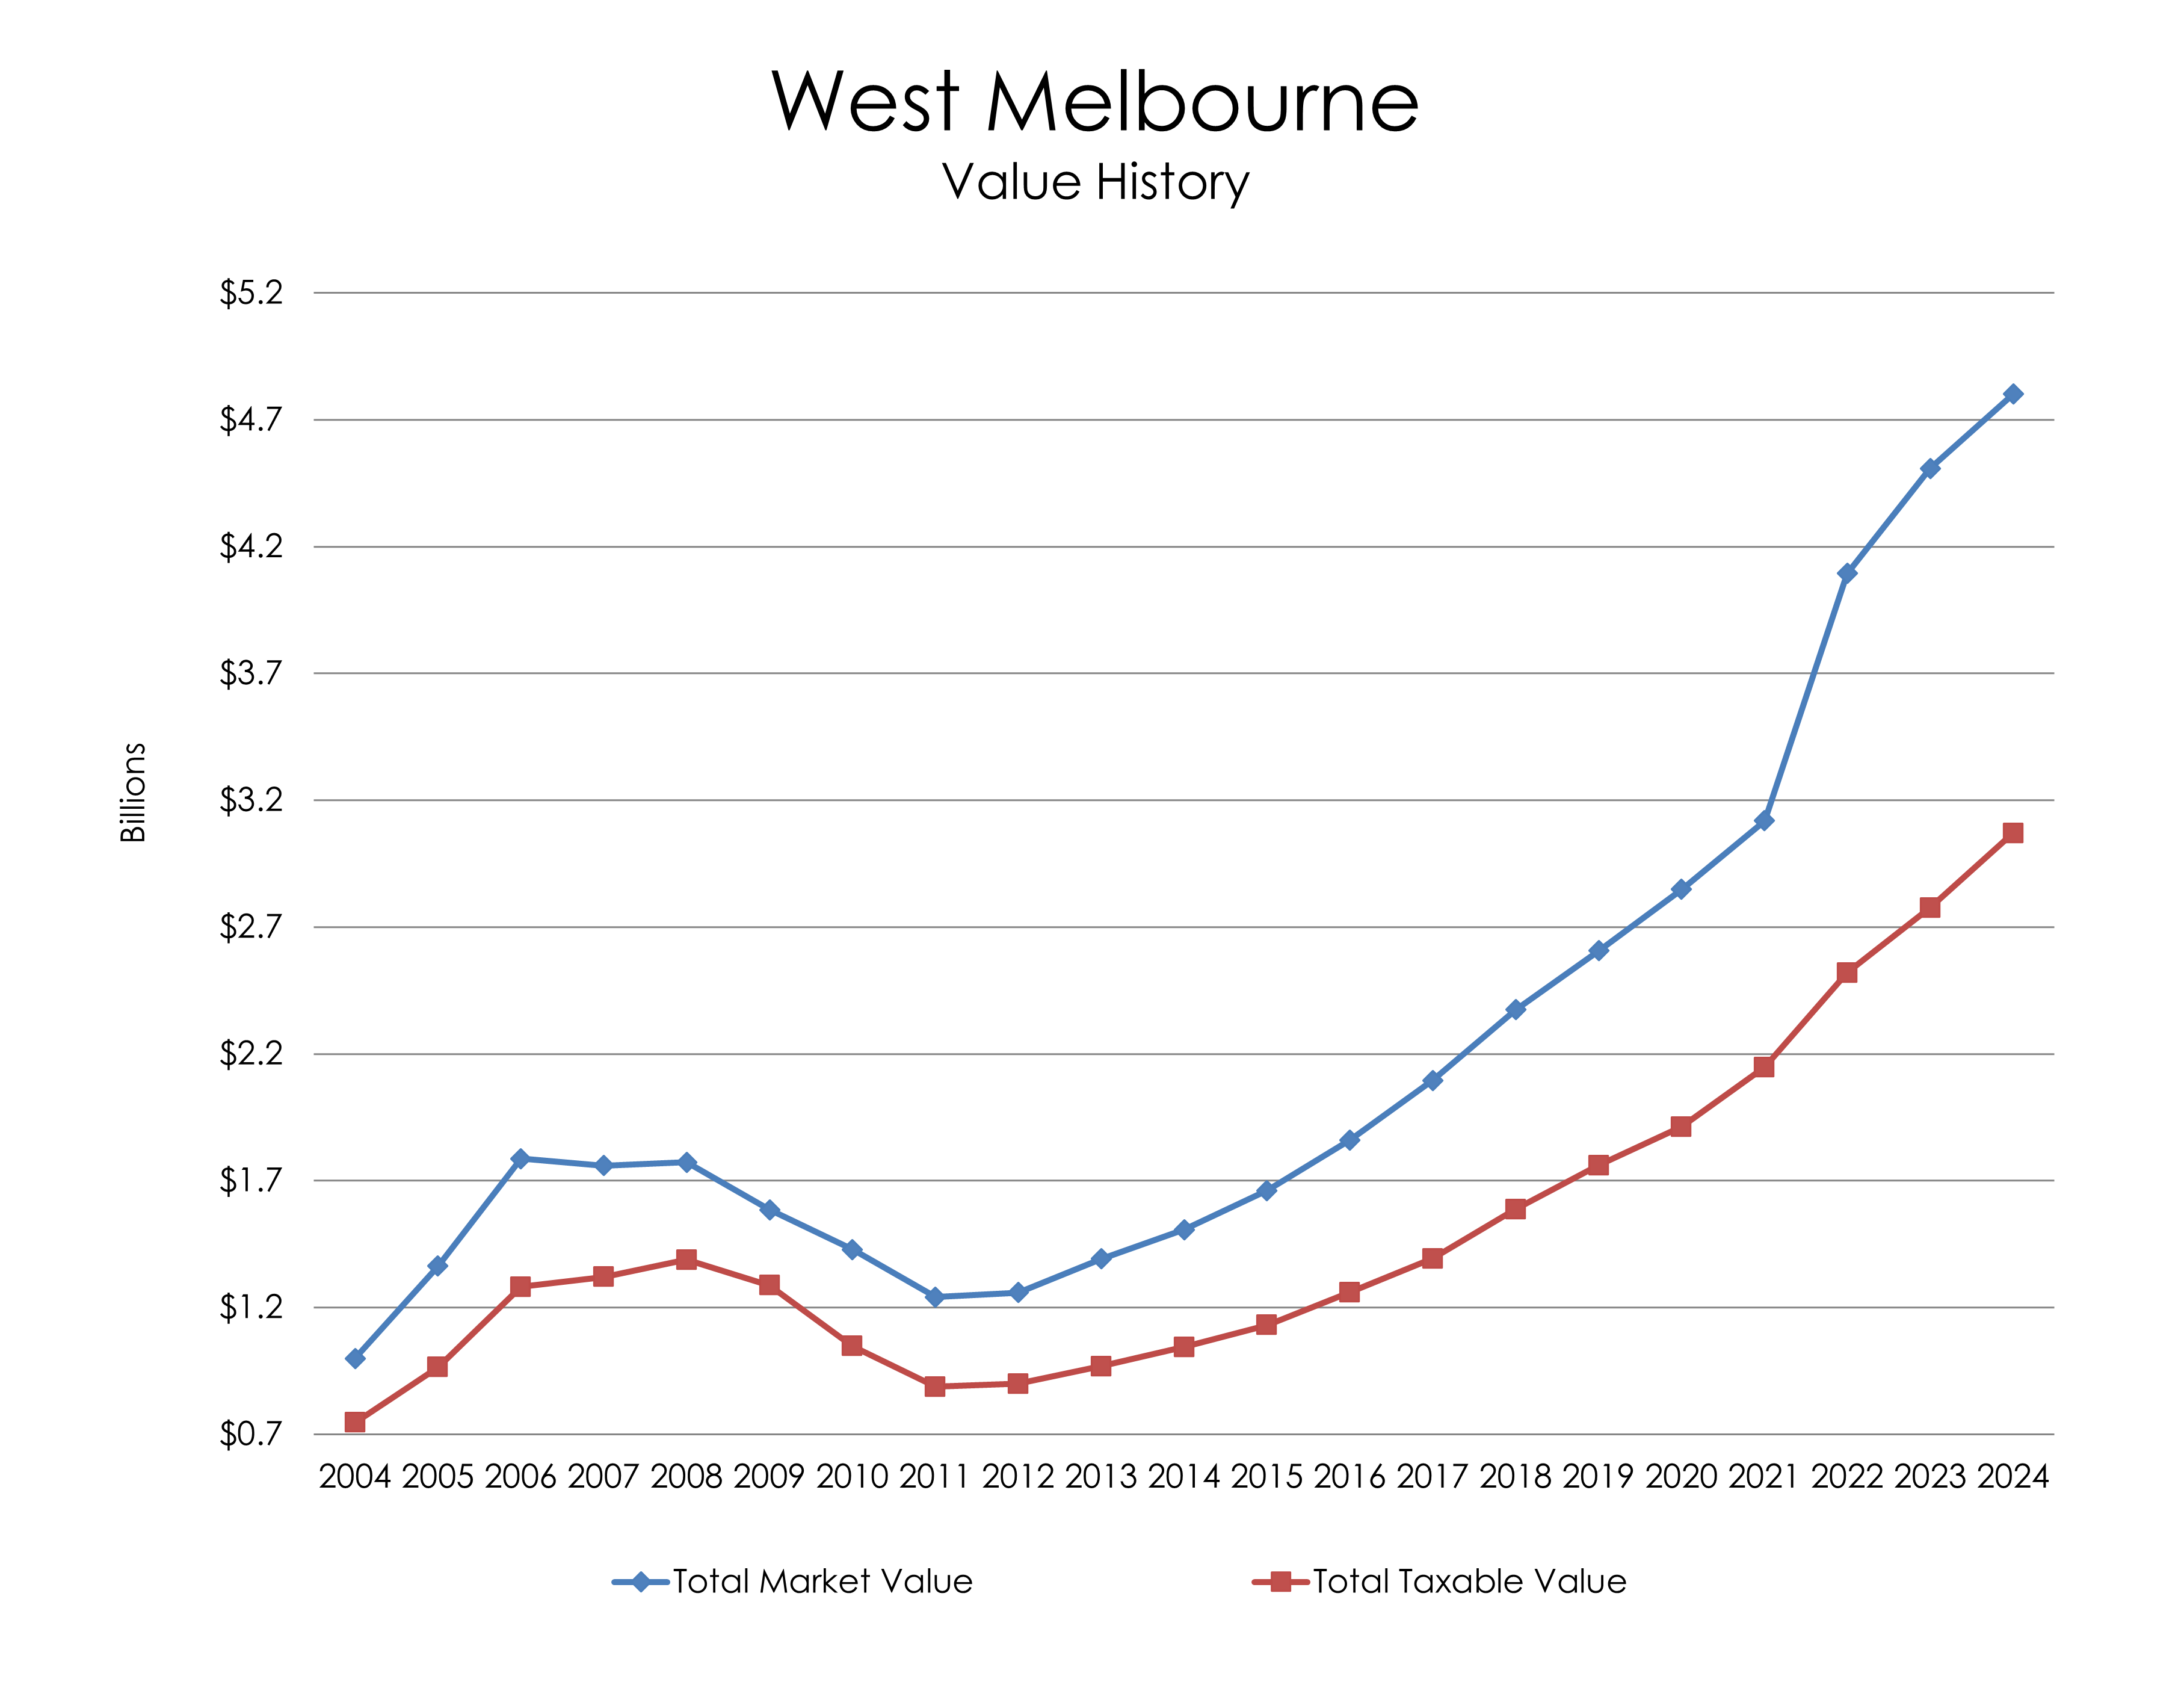 This chart shows how the City of West Melbourne's Total Market Value followed the 2005-2008 real estate boom and subsequent bubble burst. Total Taxable Value also reached a high point during this time, and declined rapidly as market values plunged.